ZigZag connects selected price highs and lows, leaving smaller fluctuations between them out of the line. It makes swing structure easier to inspect, but the latest endpoint can move as prices extend. A clean historical zigzag does not show exactly when every turning point became available.
What the ZigZag indicator shows
The line is a retrospective filter of price movement. The earlier BrokerCheck guide describes uses in swing trading, trend channels, Elliott wave analysis, support and resistance, Fibonacci anchors, and patterns such as head and shoulders, triangles and double tops or bottoms. Those uses involve interpreting the selected swings; the line itself does not calculate a future price.
The guide emphasizes the trade-off between sensitivity and noise, and discusses clear trends, sideways markets, asset volatility, fundamental context and historical testing. Its trading applications are descriptions of analytical approaches. The examples here measure the line and its revisions, without testing an entry or exit strategy.
Depth, Deviation and Backstep settings
The earlier guide defines Depth as a minimum number of bars without a new high or low, Deviation as the required percentage movement for a directional change, and Backstep as the minimum bar interval between highs and lows. It gives these illustrative ranges:
| Setting | Shorter-term range | Longer-term range |
|---|---|---|
| Depth | 5–10 bars | 12–20 bars |
| Deviation | 1–3% | 5–10% |
| Backstep | 1–3 bars | 3–5 bars |
Keep bar counts separate from percentage filters
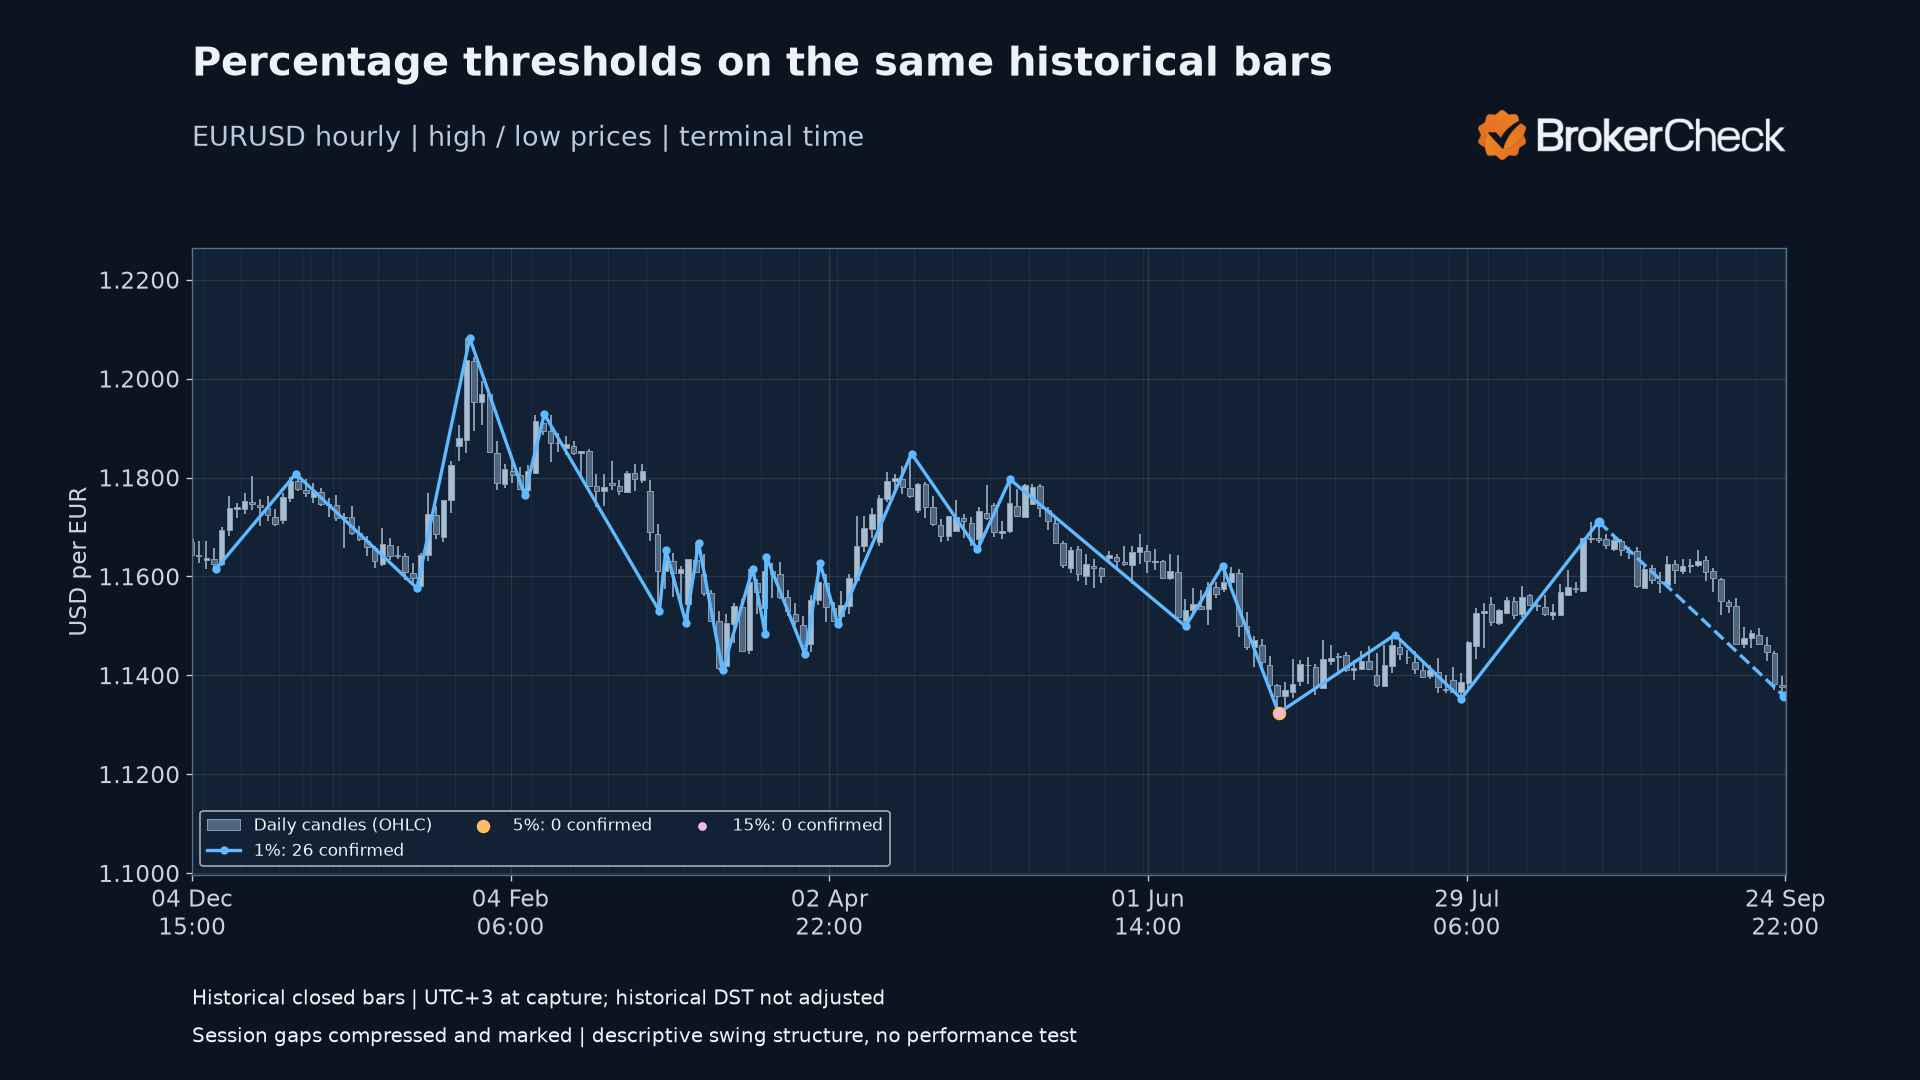
The guide also uses “Depth” for a minimum price-movement filter, with a 5%–10% starting range, >10% in high volatility and <5% in low volatility. Its Deviation discussion describes <5% as lower, 5–10% as moderate and >10% as higher. Its risk-management examples contrast 5% and 15% filters. These percentage descriptions are retained here as percentage thresholds; they are not converted into bar counts.
The download makes the units explicit: Depth is a trailing window in bars; DeviationPercent is a reversal percentage measured from the pending endpoint price; Backstep is the minimum distance in bars to an opposite endpoint. This is the precise convention used below. It is not a points-based deviation setting, and agreement with another platform’s ZigZag is not assumed.
Backstep and repainting
The guide’s Backstep table calls 1 bar highly sensitive, 2–3 bars balanced, and 4–5 bars less sensitive. It also says Backstep “prevents repainting,” while its earlier discussion warns that ZigZag can redraw. The calculation here uses Backstep only as a spacing rule. Its pending endpoint still moves, as the successive-cutoff example shows.
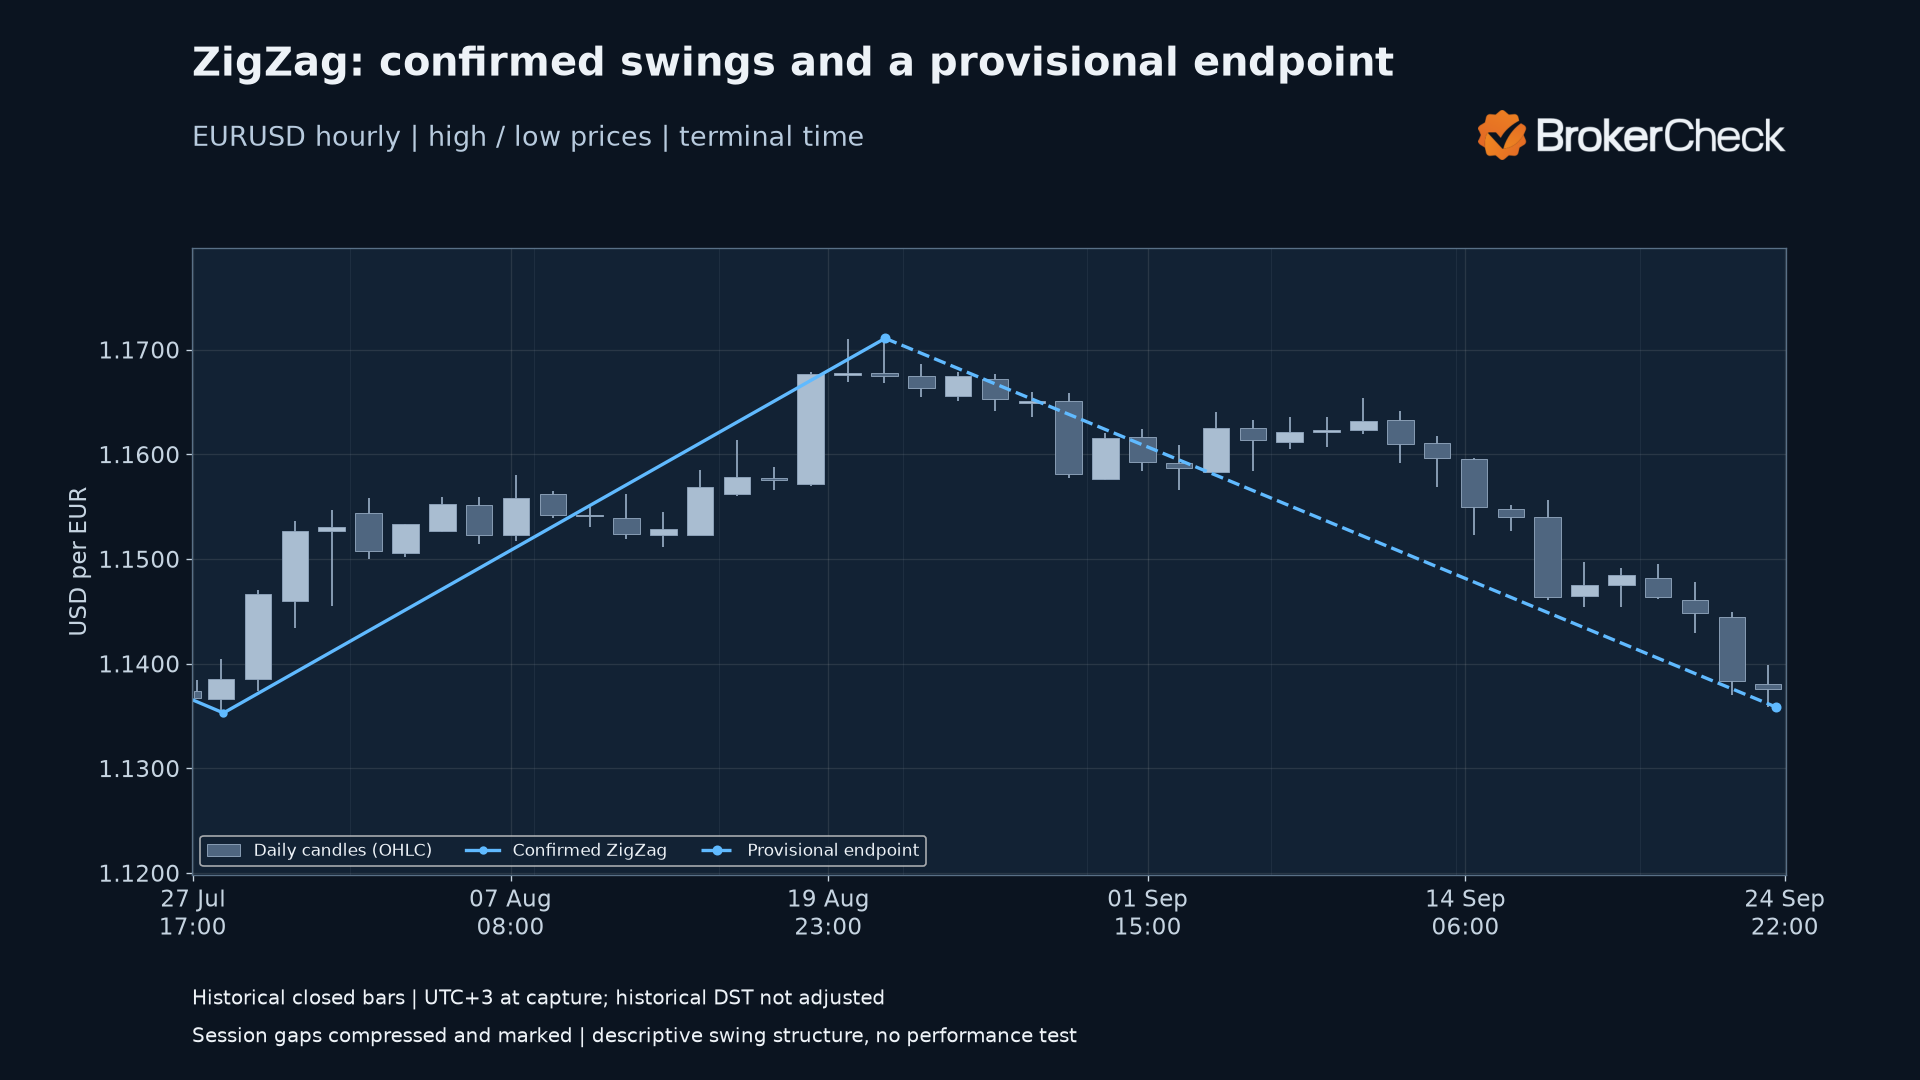
The last plotted turning point is a candidate, not a completed historical fact at the moment it first appears.
The exact calculation in this download
The illustrative defaults are Depth 12 bars, DeviationPercent 1%, and Backstep 3 bars. These combine values discussed in the guide; they are not optimized or presented as best settings.
- Read bars chronologically. Wait for a full Depth window, then seed its earliest minimum low as a provisional endpoint. Processing continues on the next bar.
- A high candidate must equal or exceed every high in the trailing Depth window, including the current bar. A low candidate must equal or fall below every low in that window.
- A strictly more extreme candidate of the same kind replaces the pending endpoint. Equal prices retain the earlier endpoint time.
- Otherwise, accept an opposite candidate only if its bar distance from the pending endpoint is at least Backstep and its price reversal reaches the percentage threshold below.
- Confirm the old endpoint at the acceptance bar’s close and leave the newly accepted opposite endpoint provisional. Never move a previously confirmed endpoint while merely appending unchanged closed history.
Threshold = absolute pending endpoint price × DeviationPercent ÷ one hundred
After a high: pending high − candidate low must reach Threshold
After a low: candidate high − pending low must reach Threshold
Outside bars, live bars and history changes
An outside bar may offer both an extension and a reversal. Extension takes priority, with at most one change per bar, because high and low prices do not reveal intrabar ordering. No opposite pivot is accepted on that same extension bar. The native indicator recalculates all available bars on every call. Its newest bar can still change; the historical examples below contain only closed bars.
Depth and Backstep must be positive whole-bar counts; the reversal percentage must be positive and finite. Highs and lows must be positive and finite, with the high no lower than the low. Insufficient history gives no line. Changes to old bars, available history or settings trigger a fresh result; the stability statement applies only to appending closed bars with identical earlier data and settings.
Real EURUSD examples
The historical sample contains 5000 closed hourly bars from 2025-12-04 15:00 to 2026-09-24 22:00. Times are terminal bar-open times, with UTC+3 measured at capture; historical daylight-saving changes are not adjusted. Session gaps are compressed and marked on the charts. These observations are not live quotes.
Confirmed swings and the unfinished leg
Different percentage thresholds on identical bars
Watch the pending endpoint repaint
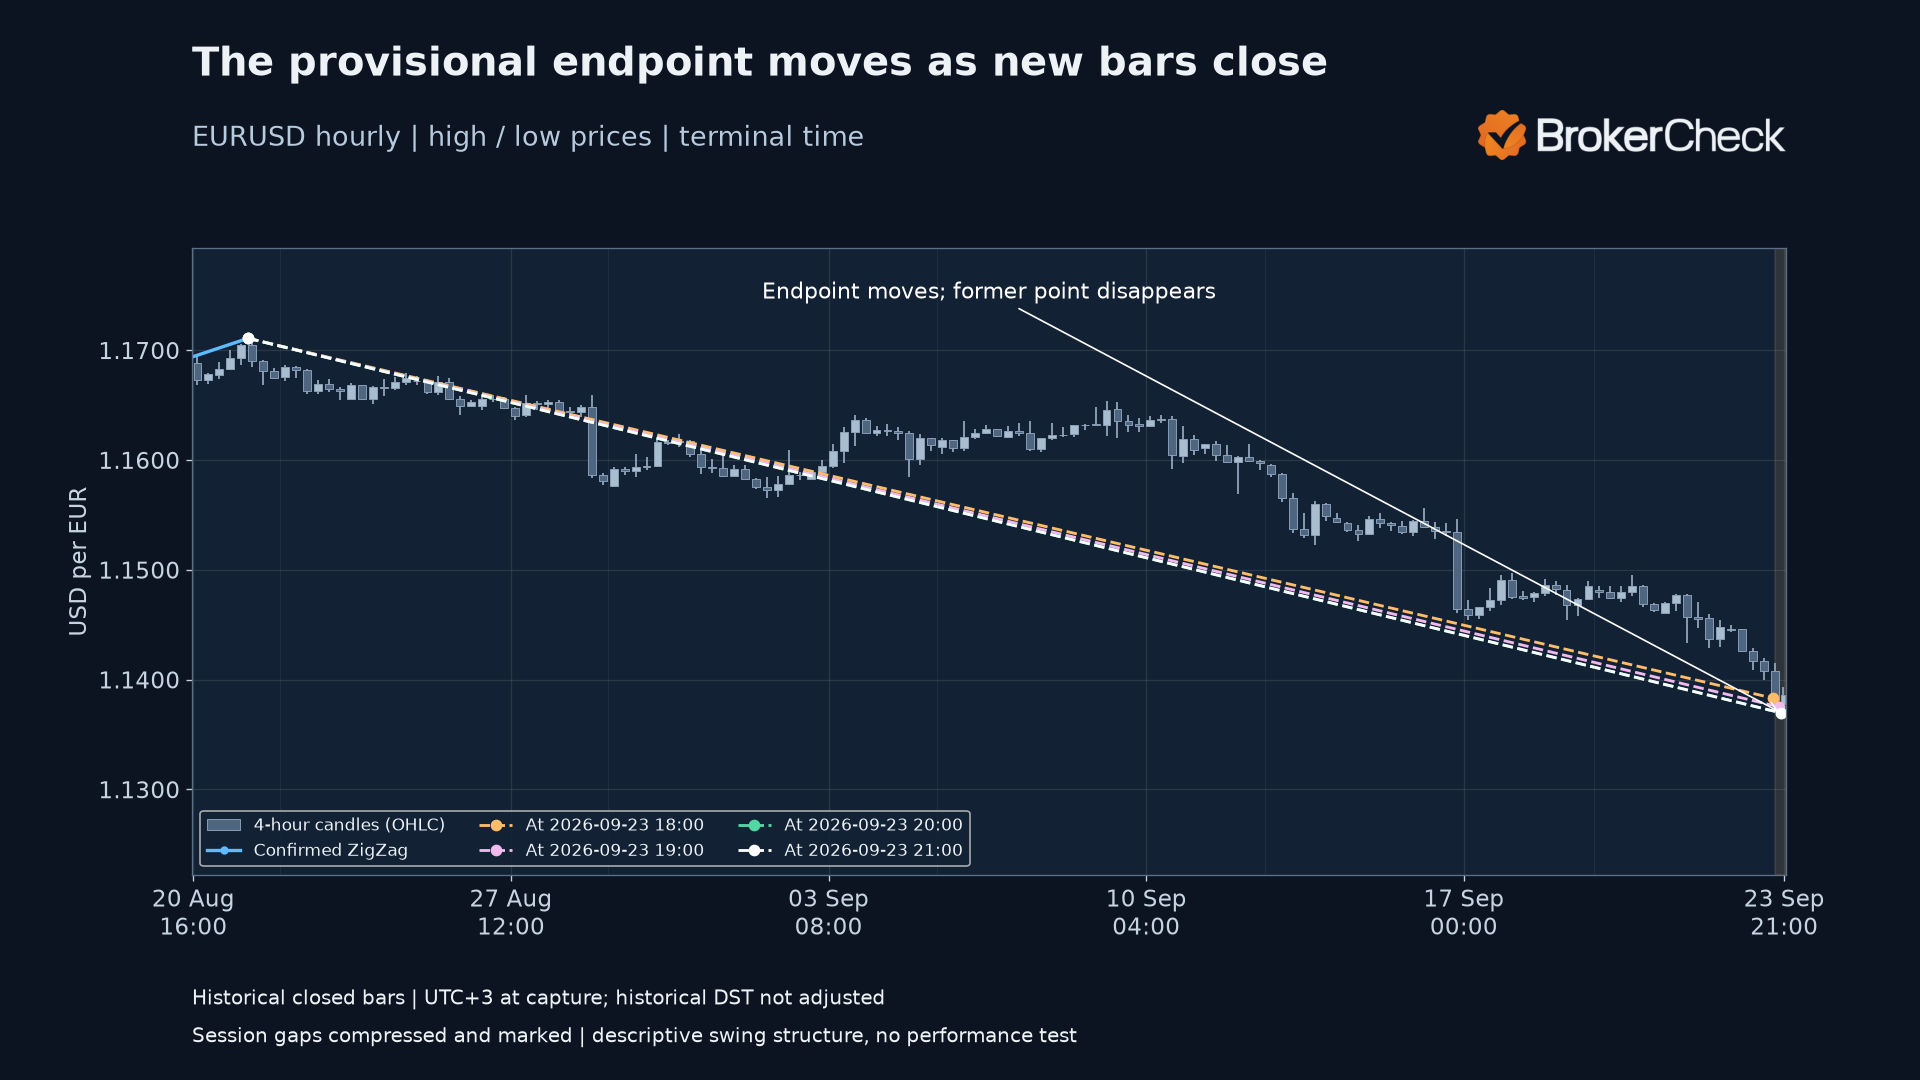
| Data available through bar | Pending endpoint bar | Endpoint price, USD per EUR |
|---|---|---|
| 2026-09-23 18:00 | 2026-09-23 17:00 | 1.13830 |
| 2026-09-23 19:00 | 2026-09-23 19:00 | 1.13752 |
| 2026-09-23 20:00 | 2026-09-23 20:00 | 1.13696 |
| 2026-09-23 21:00 | 2026-09-23 20:00 | 1.13696 |
Each row uses only bars available through that cutoff, at the bar close. When the endpoint moves, its old plotted point vanishes. The connecting leg is redrawn to the new extreme. The example is the most recent sequence of successive cutoffs meeting the stated condition: repeated pending-endpoint changes with an unchanged confirmed set. It was not selected by subsequent returns.
Using ZigZag for swing structure
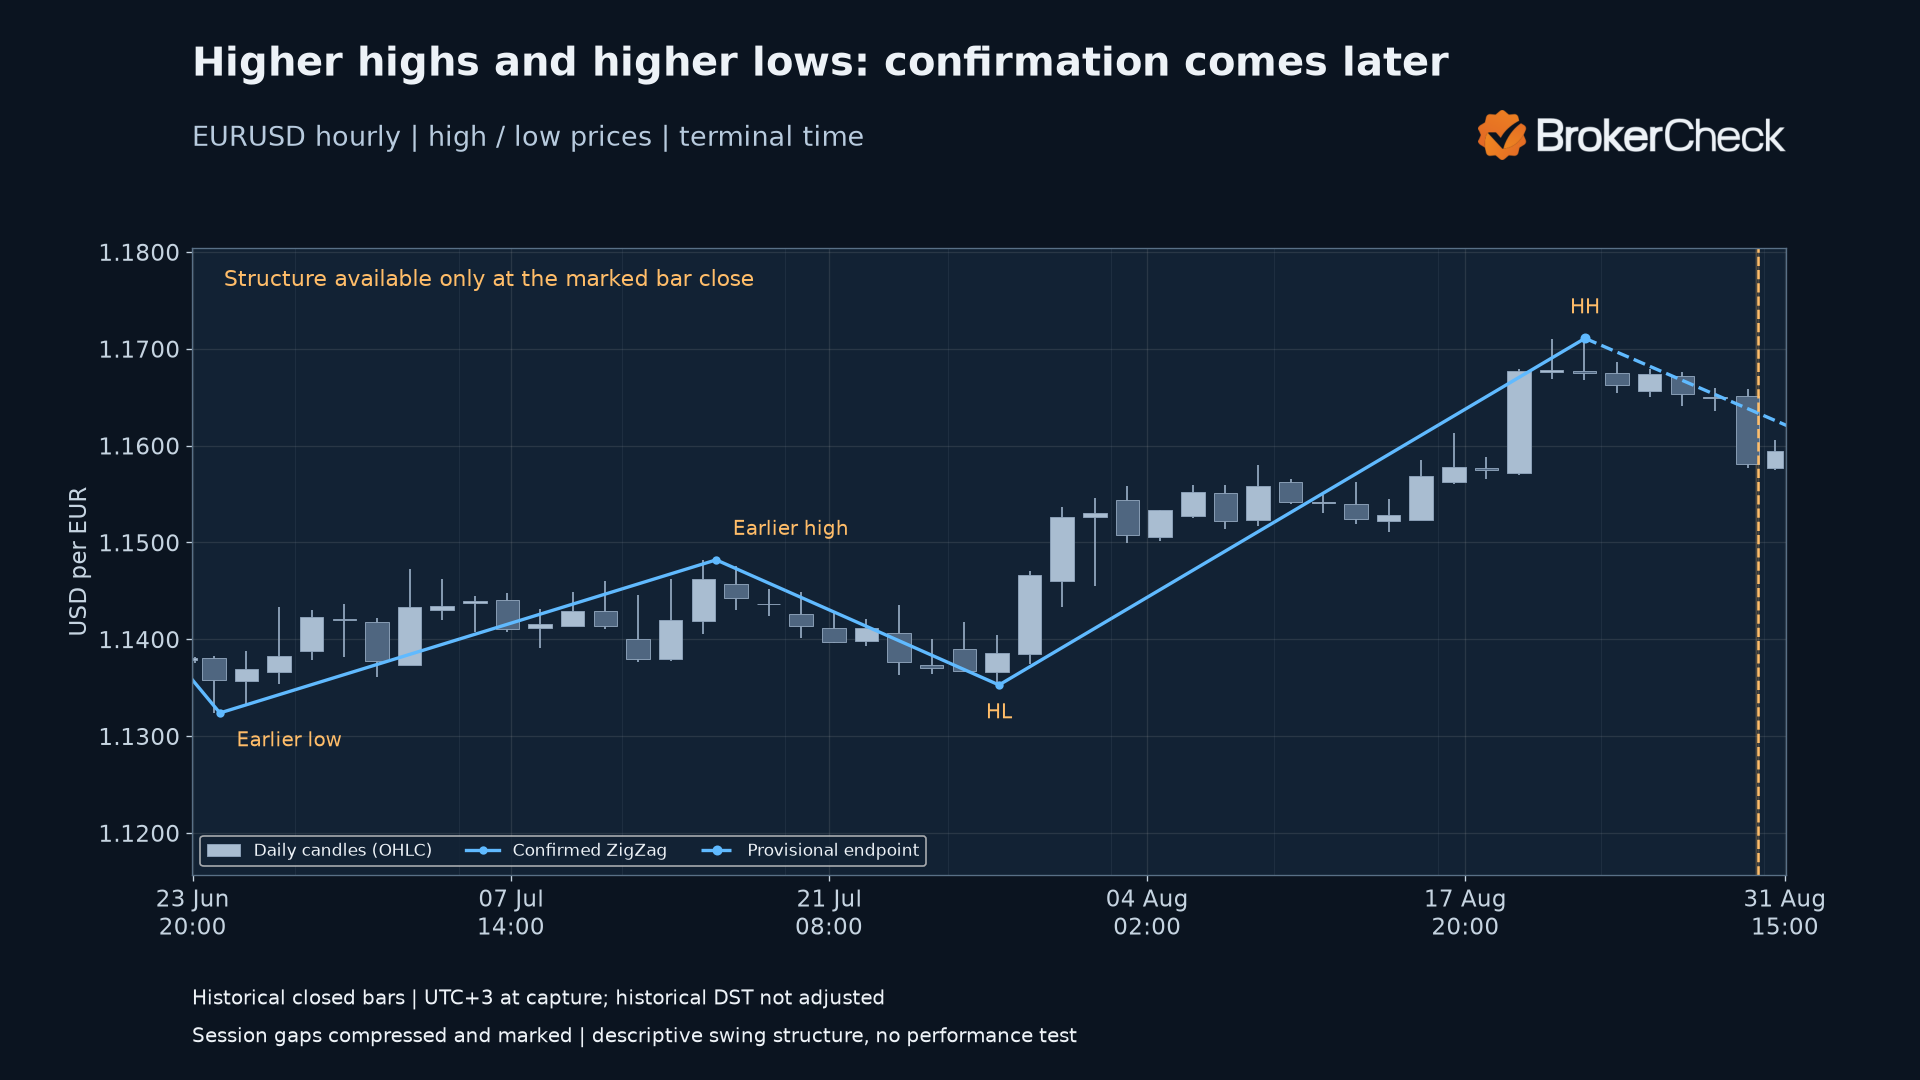
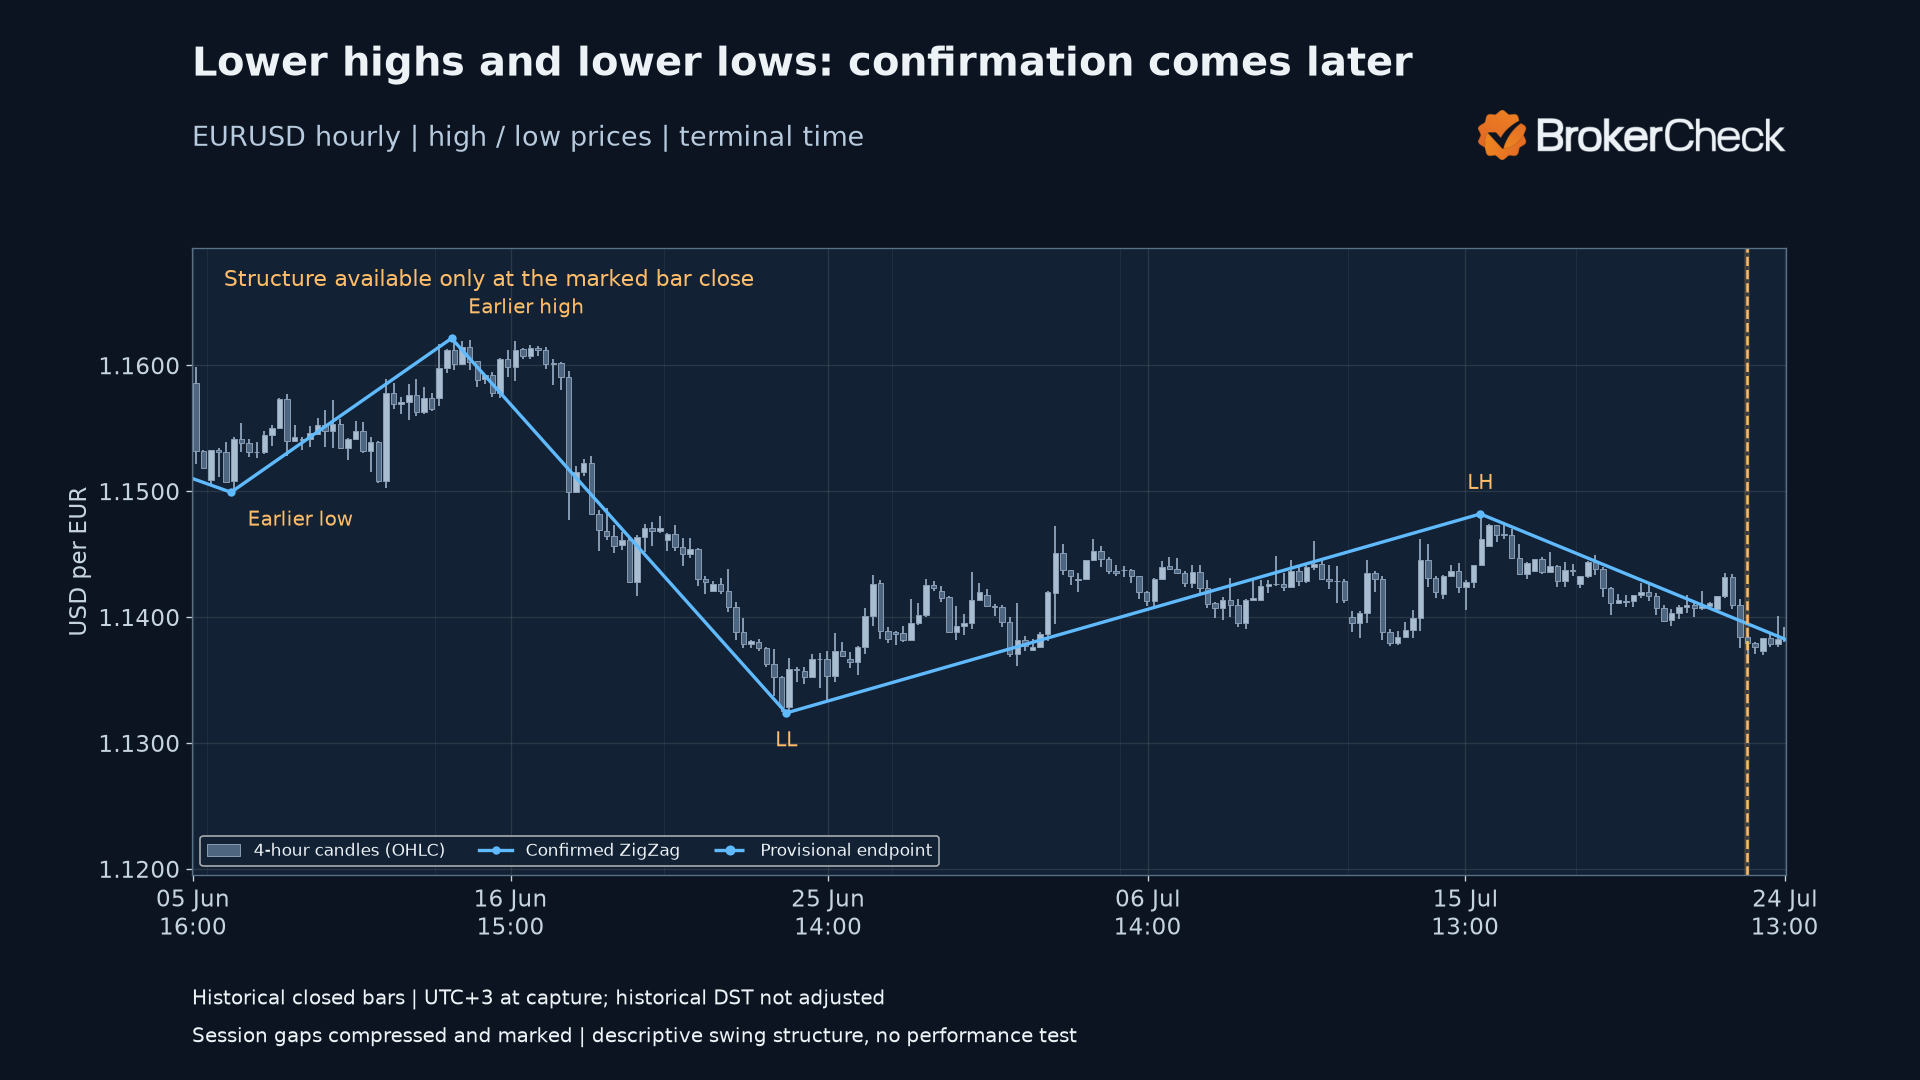
A higher high compares a confirmed high with the preceding confirmed high; a higher low compares a confirmed low with the preceding confirmed low. Lower highs and lower lows use the opposite strict comparison. Equal prices are equal swings, not higher or lower ones. No intervening same-kind pivot is skipped.
For these examples, upward structure requires both the latest high and the latest low to exceed their same-kind predecessors. Downward structure requires both to be lower. Other combinations are mixed. The classification becomes available only when the last participating pivot is confirmed, at the marked bar close—not at its earlier extreme.
Higher highs and higher lows
Lower highs and lower lows
Other indicators, timeframes and market context
The earlier guide pairs ZigZag with moving averages for trend direction and crossings, MACD for momentum and divergence, RSI for divergence and its above-70/below-30 readings, and Fibonacci retracements for price-level comparisons. It also discusses volume increases, fundamental analysis and combining distinct kinds of information. None of those companion calculations is included in this download, and no combined signal or probability is measured here.
Adjusting settings without calling them optimal
The guide discusses increasing Depth and Deviation for volatile conditions and reducing them for lower volatility or shorter trading horizons; lowering Backstep is its proposal when short reversals are omitted. Its timeframe table contrasts 1–15-minute forex or cryptocurrency charts with daily and weekly equity charts. It also names the 24-hour forex cycle, stock sessions and commodity cycles as context. The worked examples remain hourly EURUSD throughout.
To inspect a change, hold the data and other settings fixed, compare which pivots remain, and examine successive cutoffs. A chart with fewer segments establishes only a different filtered history. The guide recommends historical testing and demo experimentation; this guide supplies descriptive calculations, not evidence of an optimal parameter or strategy performance.
Stops, targets and the limits of retrospective swings
The guide discusses placing stops below swing lows or beyond reversal points, targets near recent highs or projected points, and adjusting orders as new pivots form. It also emphasizes disciplined decisions and the emotional difficulty of accepting losses. These are its proposed uses of swing levels; no order-placement, position-sizing or target-projection algorithm is implemented here.
A pending low may later move lower. A historical pivot timestamp also precedes its confirmation timestamp. Any separate trading test would need to use information available at the time, rather than treating the final historical line as an immediately available signal.
A tidy line through old price extremes does not establish an entry price, an exit price or a future outcome.
Download the indicator and historical examples
The MQL5 indicator overlays the percentage ZigZag on price. It has no orders, alerts or companion indicators. The final leg is provisional even though the native line uses a single drawing style; the separate historical charts distinguish it with dashes. Native chart attachment and drawing have not been tested.
The native calculation matched the reference across 330433 nonempty buffer values, with maximum absolute difference 0.0. This checks arithmetic and pivot placement, not trading performance.
Read calculation and setup notes.
- Put the compiled file in the platform’s custom-indicator folder, or compile the source with the platform editor.
- Attach through the custom-indicator controls and select the intended chart timeframe.
- Enter positive Depth and Backstep bar counts and a positive DeviationPercent. Check the units before comparing with another ZigZag.
- Observe the pending endpoint as bars arrive and distinguish its timestamp from confirmation time.
What the examples establish
- The last endpoint is provisional.
- Confirmation belongs to the acceptance bar close, not the earlier extreme.
- Settings and history determine the selected swings.
The charts show a specific percentage-based rule on a fixed historical feed. The downloaded CSV contains the final full-history result; it is not a replay of what every earlier chart displayed. The cutoff table supplies that narrower replay example. No transaction costs, entries, exits, returns, win rates or predictive accuracy were measured. Different rules, data feeds, history starts and settings can produce different swings.
Frequently asked questions
Does ZigZag repaint?
The pending endpoint can move to a later extreme, removing its earlier point. In this calculation, previously confirmed endpoints stay fixed when unchanged closed history is extended.
When is a pivot confirmed?
When a qualifying opposite endpoint is accepted, at that acceptance bar’s close. An extreme’s timestamp is earlier than the time its confirmation becomes available.
Is Deviation measured in points?
This download uses a percentage of the pending endpoint price. A points-based ZigZag uses a different unit and is not assumed to agree.
What does Depth mean here?
It is the trailing candidate window in bars, with an illustrative default of 12. The guide also discusses percentage filters; those percentages are not bar counts.
Does Backstep stop all repainting?
No. It limits the bar distance to an opposite endpoint in this calculation. The pending endpoint can still move.
What are higher highs and higher lows?
They are strict increases between consecutive confirmed highs and between consecutive confirmed lows. Both comparisons are required for the upward-structure example.
Are these the best settings?
No optimal setting or trading performance was established. The examples describe the chosen rule on historical data; they do not forecast price moves.