
1. Overview OF Candlestick Patterns
Candlestick patterns are a cornerstone of technical analysis in financial markets, providing traders and investors with critical insights into market psychology and potential future price movements. Developed in Japan, candlestick patterns have stood the test of time, evolving into a vital tool for modern traders. These patterns graphically represent price movements within a specific time frame, offering a visual method to interpret market sentiment.
1.1. Defining Candlestick Patterns
A candlestick chart is composed of individual “candlesticks,” each representing the price movement within a specific period, such as one day, one hour, or even one minute. Each candlestick has three essential components:
- Body: The body of the candlestick is the wide part that represents the difference between the opening and closing prices during the period. A long body indicates a large opening-to-closing price difference; a short body indicates a small difference.
- Shadows (Wicks/Tails): The shadows are the thin lines above and below the body, representing the highest and lowest prices during the period. The upper shadow shows the difference between the highest price and the close (for a bullish candle) or open (for a bearish candle). The lower shadow shows the difference between the lowest price and the open (for a bullish candle) or close (for a bearish candle).
- Color: The color of the candlestick provides a quick visual cue to the market’s direction. Typically, a green or white candlestick indicates that the closing price was higher than the opening price (bullish), while a red or black candlestick indicates that the closing price was lower than the opening price (bearish).
1.2. Importance of Understanding Candlestick Patterns
For traders and investors, understanding candlestick patterns is crucial because they can signal potential market reversals, continuations, or even indecision. This knowledge allows market participants to make more informed decisions, whether they’re identifying entry and exit points, managing risk, or predicting future price movements. Recognizing these patterns does not establish that a trade will be profitable.
Candlestick patterns are not just about recognizing shapes on a chart; they are about understanding the underlying psychology of market participants. Each pattern represents a battle between buyers and sellers, and by learning to read these patterns, traders can gain insights into the likely direction of price movements.

| Component | Description |
|---|---|
| Body | Represents the difference between the opening and closing prices within a specific period. A long body indicates a large opening-to-closing price difference. |
| Shadows (Wicks) | The lines above and below the body showing the highest and lowest prices during the period. Long upper or lower shadows can suggest resistance or support, respectively, depending on context. |
| Color | Visual cue for market direction: green/white for bullish (close > open) and red/black for bearish (close < open). |
2. Understanding Candlestick Patterns
2.1. Bullish Patterns
Bullish candlestick patterns are signals that indicate a potential reversal of a downtrend or the continuation of an uptrend. These patterns suggest that buyers are gaining control, and prices are likely to move higher. Understanding these patterns is crucial for traders looking to identify buying opportunities in the market.
1. Hammer
The Hammer is a single candlestick pattern that often appears at the bottom of a downtrend, signaling a potential reversal to the upside. It has a small body near the top of the range, a long lower shadow, and little to no upper shadow.
- Characteristics:
- Small real body at the upper end of the trading range.
- Long lower shadow that is at least twice the length of the body.
- Minimal or no upper shadow.
- Significance: The long lower shadow indicates that sellers pushed the price down during the session, but by the close, buyers had driven it back up, suggesting strong buying pressure. If followed by a bullish confirmation (such as a gap up or a large bullish candle), the hammer can signal a bullish reversal.

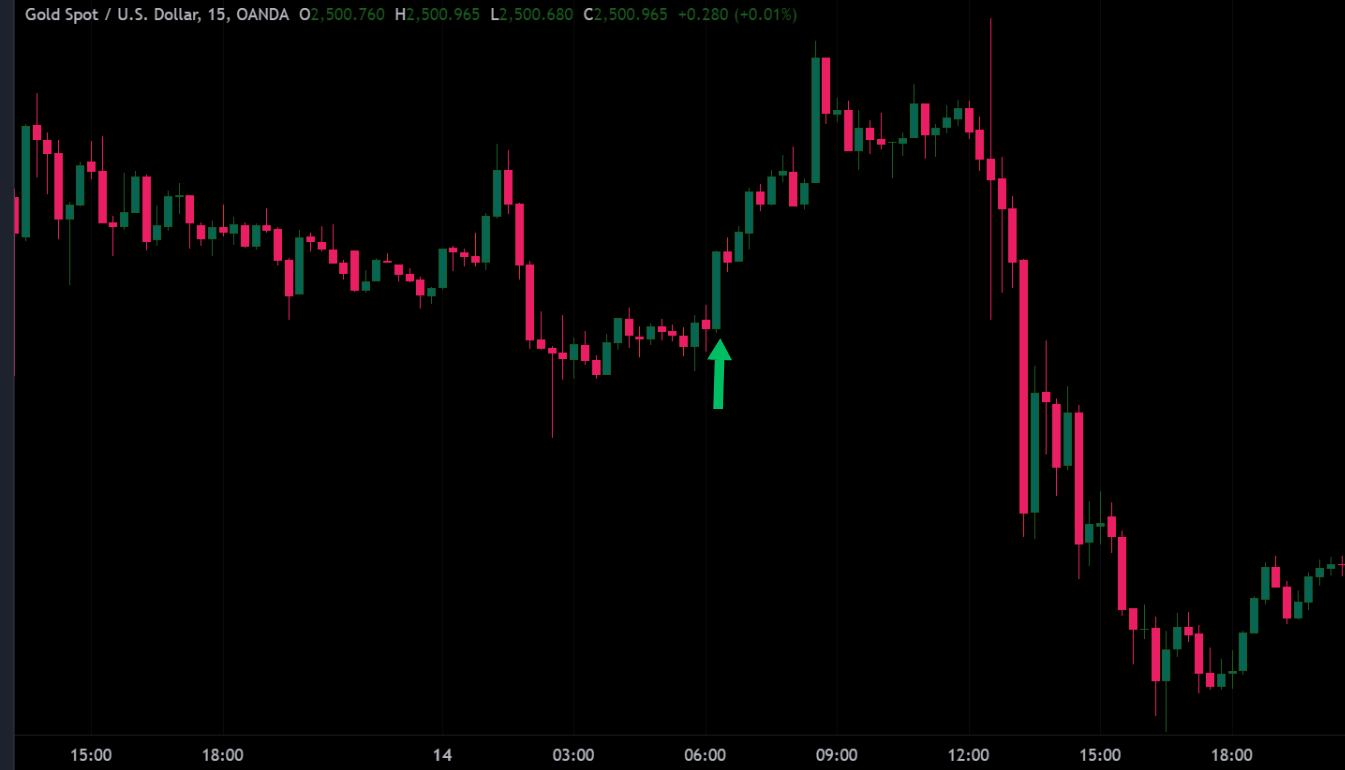
2. Bullish Engulfing
The Bullish Engulfing pattern is a two-candlestick pattern that signals a potential reversal during a downtrend. It occurs when a small bearish candlestick is followed by a larger bullish candlestick that completely engulfs the previous candle’s body.
- Characteristics:
- The first candle is bearish with a small body.
- The second candle is bullish with a larger body that fully engulfs the body of the first candle.
- Significance: This pattern indicates a shift in momentum from sellers to buyers. The fact that the second candle engulfs the first one suggests strong buying interest, often leading to further upward movement.
3. Morning Star
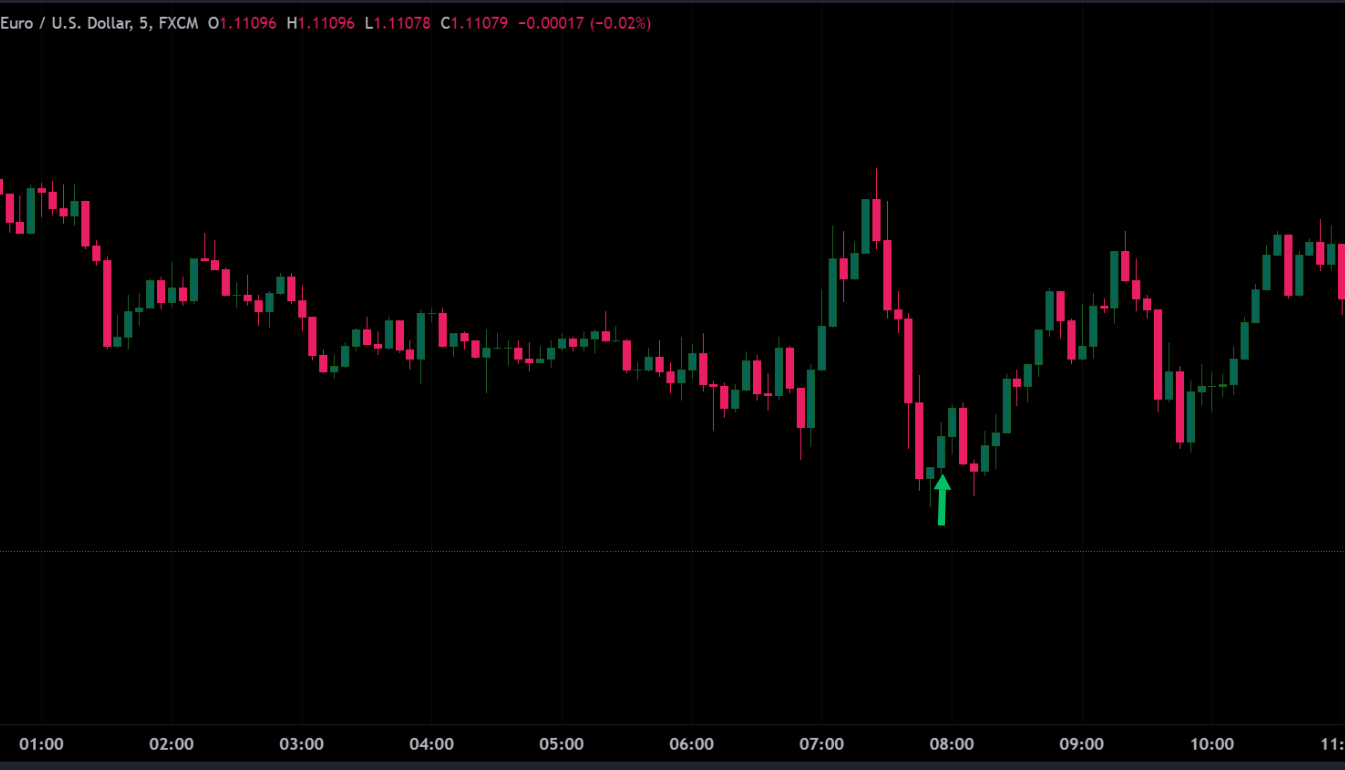
The Morning Star is a three-candlestick pattern that indicates a potential bullish reversal after a downtrend. It consists of a large bearish candle, followed by a small-bodied candle (which can be bullish or bearish), and then a large bullish candle.
- Characteristics:
- The first candle is bearish, reflecting continued selling pressure.
- The second candle has a small body that, in the classical pattern, gaps below the first candle’s body, suggesting indecision.
- The third candle is bullish and closes well into the body of the first bearish candle.
- Significance: The Morning Star pattern suggests that the selling pressure is waning, and buyers are stepping in. The large bullish third candle confirms that a reversal is likely, making this pattern a strong indicator of a potential upward trend.
2.2. Bearish Patterns
Bearish candlestick patterns are signals that indicate a potential reversal of an uptrend or the continuation of a downtrend. These patterns suggest that sellers are gaining control, and prices are likely to move lower. Recognizing these patterns can help traders identify selling opportunities or prepare for potential market declines.
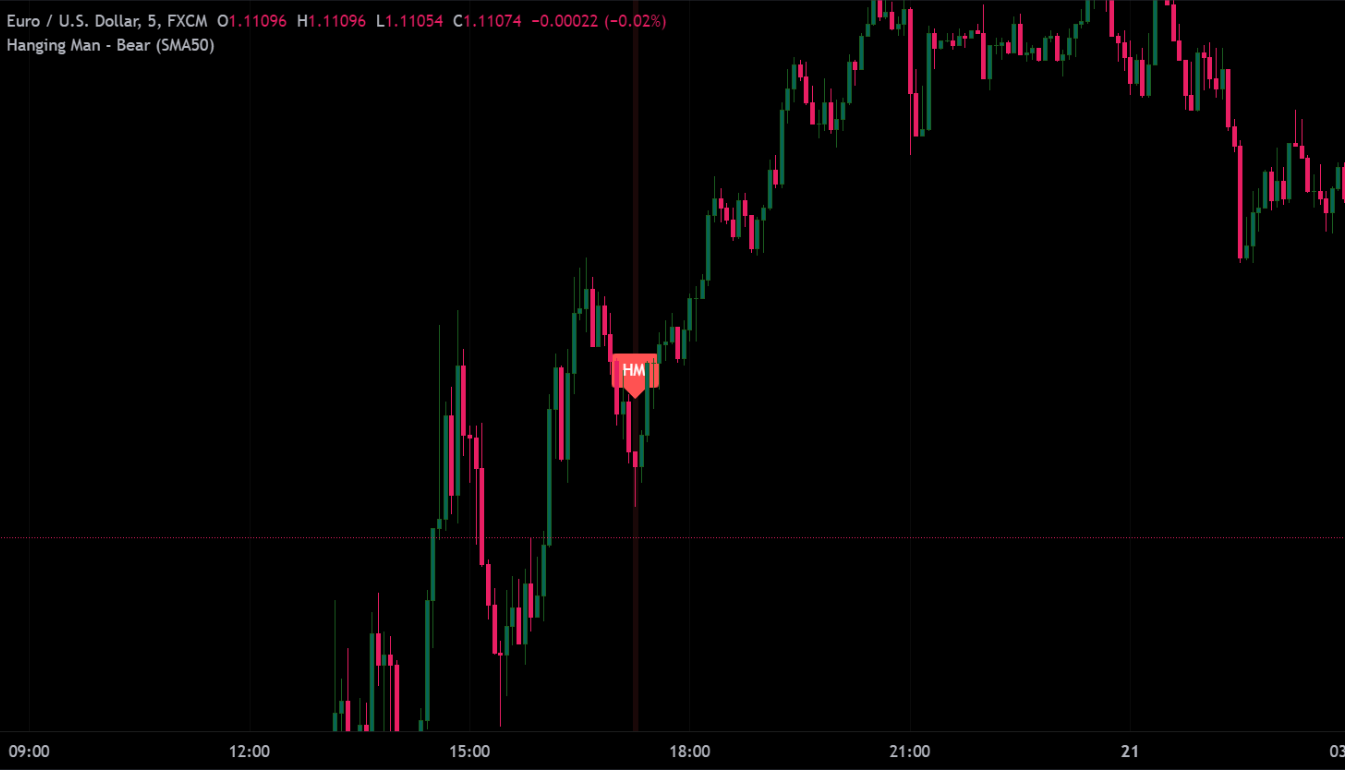
1. Hanging Man
The Hanging Man is a single candlestick pattern that appears at the top of an uptrend, signaling a potential reversal to the downside. It has a small body near the top of the range, a long lower shadow, and little to no upper shadow.
- Characteristics:
- Small real body located at the upper end of the trading range.
- Long lower shadow that is at least twice the length of the body.
- Minimal or no upper shadow.
- Significance: The Hanging Man pattern suggests that although buyers were able to drive the price higher, significant selling occurred during the session, indicated by the long lower shadow. If followed by a bearish confirmation (such as a gap down or a large bearish candle), the Hanging Man can signal a bearish reversal.
2. Bearish Engulfing
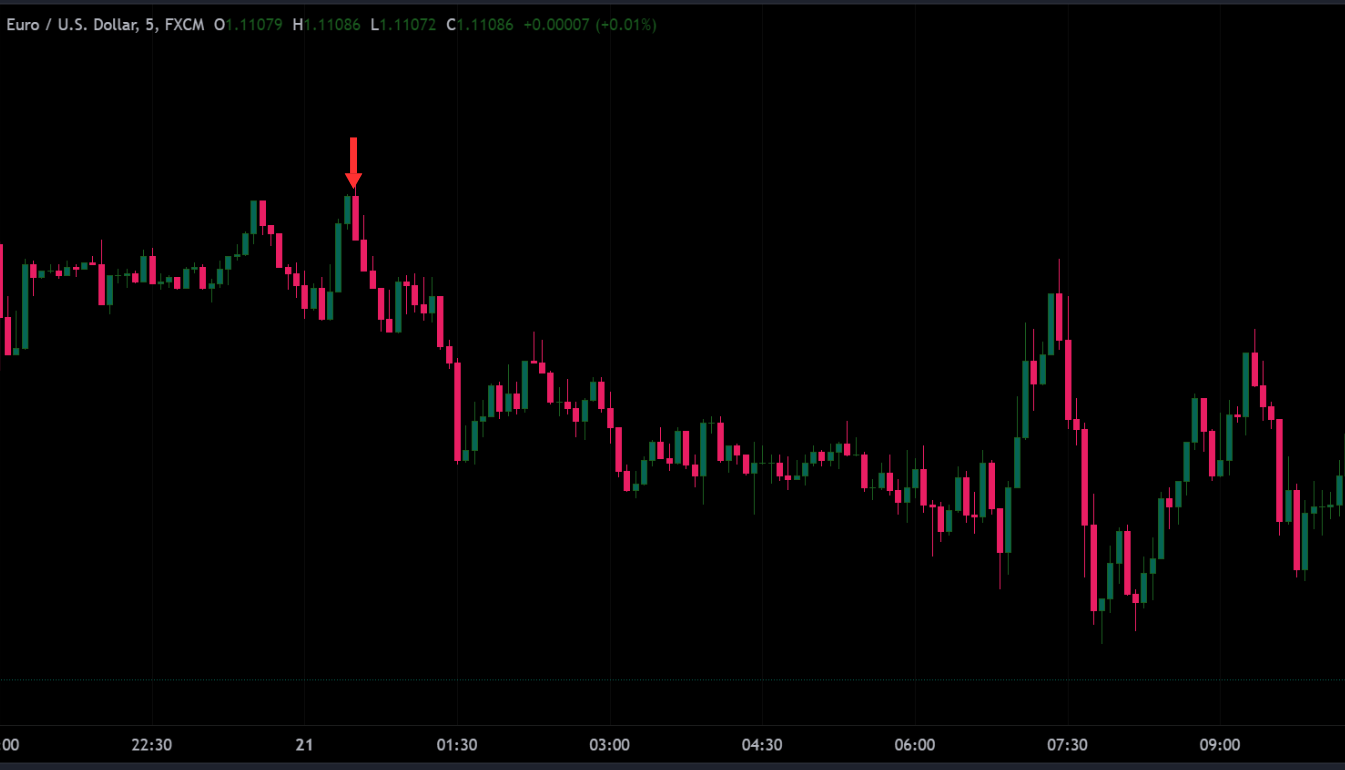
The Bearish Engulfing pattern is a two-candlestick pattern that signals a potential reversal during an uptrend. It occurs when a small bullish candlestick is followed by a larger bearish candlestick that completely engulfs the previous candle’s body.
- Characteristics:
- The first candle is bullish with a small body.
- The second candle is bearish with a larger body that fully engulfs the body of the first candle.
- Significance: This pattern indicates a shift in momentum from buyers to sellers. The fact that the second candle engulfs the first one suggests strong selling interest, often leading to further downward movement.
3. Evening Star
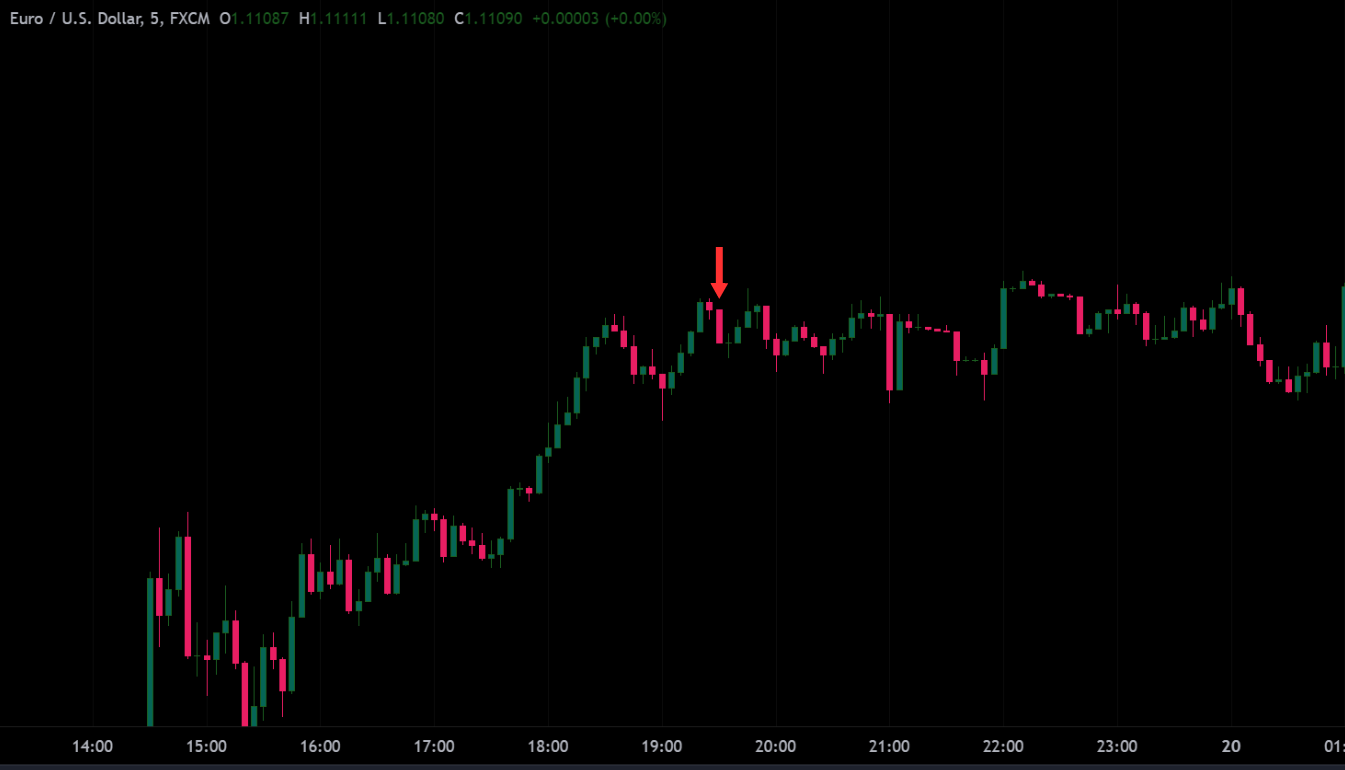
The Evening Star is a three-candlestick pattern that indicates a potential bearish reversal after an uptrend. It consists of a large bullish candle, followed by a small-bodied candle (which can be bullish or bearish), and then a large bearish candle.
- Characteristics:
- The first candle is bullish, reflecting continued buying pressure.
- The second candle has a small body that, in the classical pattern, gaps above the first candle’s body, suggesting indecision.
- The third candle is bearish and closes well into the body of the first bullish candle.
- Significance: The Evening Star pattern suggests that the buying pressure is waning, and sellers are stepping in. The large bearish third candle confirms that a reversal is likely, making this pattern a strong indicator of a potential downward trend.
These bearish candlestick patterns are crucial for traders to recognize as they can signal that an uptrend is losing steam and a reversal may be imminent. Understanding these patterns allows traders to take timely action, such as exiting long positions or considering short opportunities.
2.3. Reversal Patterns
Sections 2.3 and 2.4 cover broader chart formations spanning multiple candles. Pattern confirmation describes technical criteria being met, not a guaranteed future reversal or continuation.
Reversal patterns are powerful indicators in technical analysis that signal a potential change in the prevailing trend. These patterns can occur at the end of both uptrends and downtrends, providing traders with valuable insights into when a market is likely to reverse direction. Below are some of the most widely recognized reversal patterns:
1. Double Top/Bottom
The Double Top and Double Bottom patterns are classic reversal patterns that signal a potential change in trend direction.
- Double Top:
- Formation: This pattern forms after an extended uptrend when the price reaches a peak (top) twice at roughly the same level, with a moderate decline between the two peaks.
- Significance: The inability to break above the first peak signals weakening bullish momentum, and a break below the support level formed by the trough between the two tops confirms a bearish reversal.
- Double Bottom:
- Formation: This pattern forms after an extended downtrend when the price hits a bottom twice at roughly the same level, with a moderate rally between the two bottoms.
- Significance: The inability to break below the first bottom indicates weakening bearish momentum, and a break above the resistance level formed by the peak between the two bottoms confirms a bullish reversal.

2. Head and Shoulders / Inverse Head and Shoulders
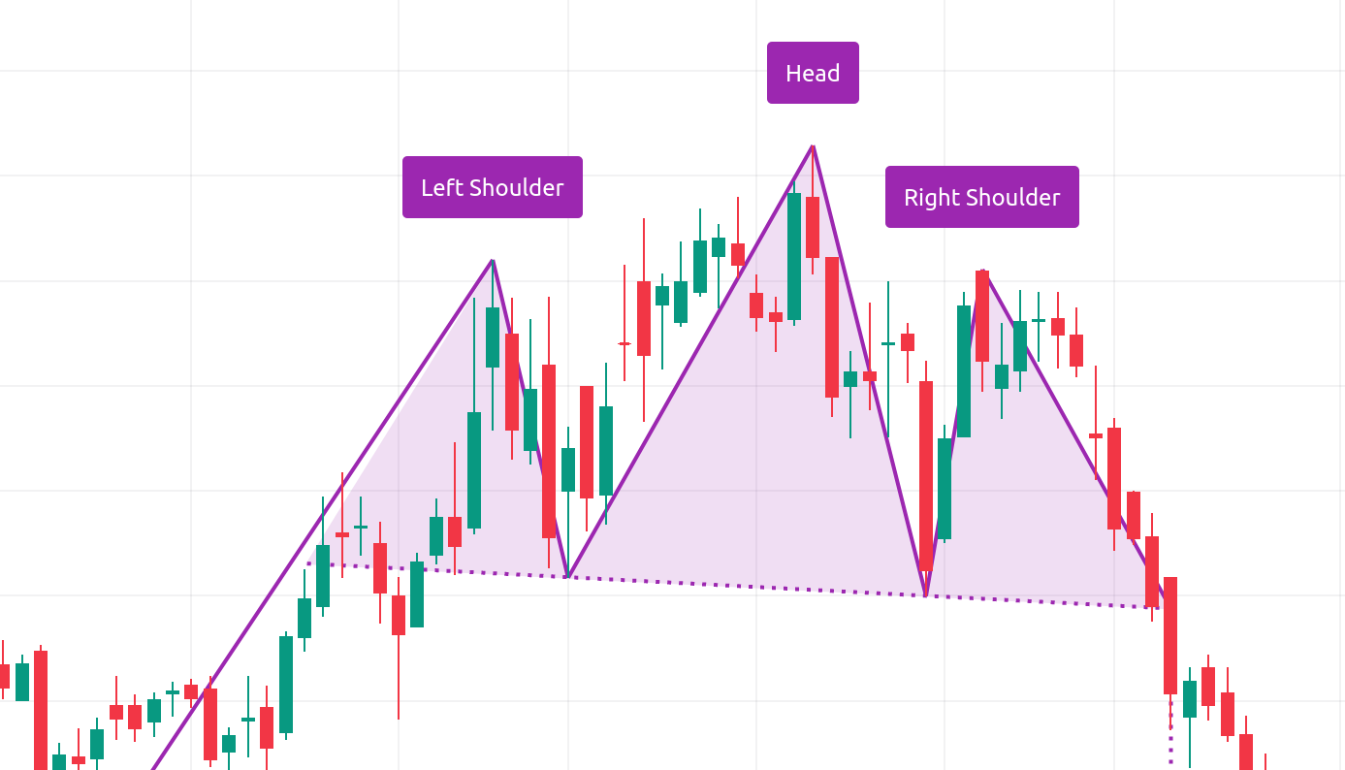
The Head and Shoulders pattern is a reliable reversal pattern that signals a potential trend reversal from bullish to bearish. Its counterpart, the Inverse Head and Shoulders, signals a reversal from bearish to bullish.
- Head and Shoulders:
- Formation: This pattern consists of three peaks: a higher peak (head) flanked by two lower peaks (shoulders). The neckline is drawn by connecting the lowest points of the two troughs.
- Significance: The pattern indicates that buying pressure is fading, with the head representing a final push higher that fails to sustain. A break below the neckline confirms a bearish reversal.
- Inverse Head and Shoulders:
- Formation: This pattern consists of three troughs: a lower trough (head) flanked by two higher troughs (shoulders). The neckline is drawn by connecting the highest points of the two peaks.
- Significance: The pattern indicates that selling pressure is waning, with the head representing a final push lower that fails to hold. A break above the neckline confirms a bullish reversal.
3. Triple Top/Bottom
The Triple Top and Triple Bottom patterns are extensions of the Double Top and Double Bottom patterns, adding a third peak or trough that signals a more significant struggle between buyers and sellers.
- Triple Top:
- Formation: This pattern forms after an uptrend, with the price reaching a peak three times at roughly the same level, with declines between each peak.
- Significance: The repeated inability to break above the resistance level shows strong bearish resistance, and a break below the support level confirms a bearish reversal.
- Triple Bottom:
- Formation: This pattern forms after a downtrend, with the price hitting a bottom three times at roughly the same level, with rallies between each bottom.
- Significance: The repeated inability to break below the support level shows strong bullish support, and a break above the resistance level confirms a bullish reversal.

hese reversal patterns are crucial tools for traders, allowing them to identify potential trend changes and adjust their trading strategies accordingly. Whether a trader is looking to exit a position in anticipation of a reversal or enter a new trade to capitalize on the changing trend, these patterns offer tentative interpretations that can fail.
2.4. Continuation Patterns
Continuation patterns are technical analysis signals that suggest the current trend—whether bullish or bearish—will likely continue after a period of consolidation. These patterns help traders identify opportunities to enter a trade in the direction of the prevailing trend, often at a favorable price. Below are some of the most common continuation patterns:
1. Flag
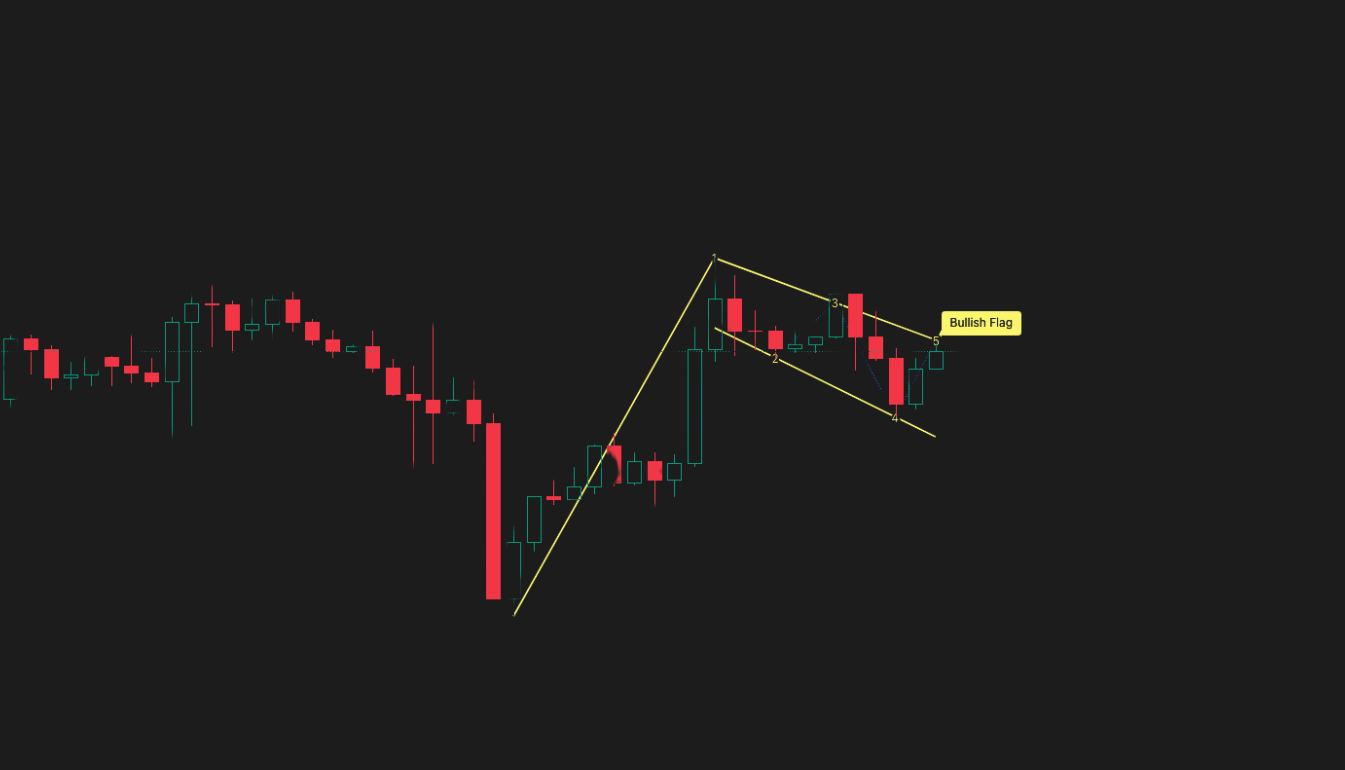
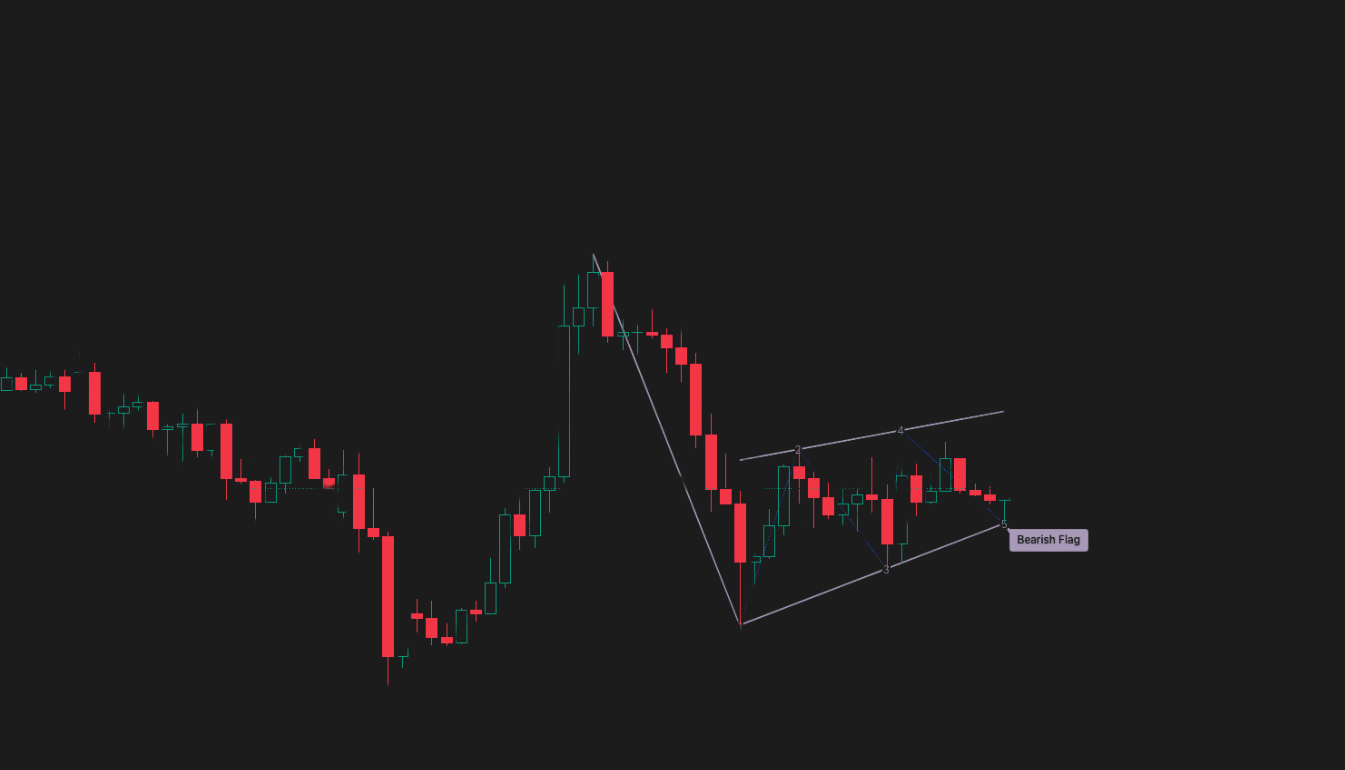
The Flag pattern is a short-term continuation pattern that typically forms after a sharp price movement (either up or down). It resembles a small rectangle or parallelogram that slopes against the prevailing trend.
- Formation:
- Bullish Flag: Occurs after a strong upward move, followed by a brief consolidation period where the price moves slightly downward or sideways in a tight range.
- Bearish Flag: Occurs after a strong downward move, followed by a brief consolidation period where the price moves slightly upward or sideways in a tight range.
- Significance: The Flag pattern indicates a pause in the prevailing trend, allowing the market to catch its breath before continuing in the same direction. A breakout above (bullish) or below (bearish) the flag confirms the continuation of the trend.
2. Pennant
The Pennant pattern is similar to the Flag but has a more triangular shape. It also forms after a sharp price movement, followed by a period of consolidation.
- Formation:
- Bullish Pennant: Occurs after a strong upward move, followed by a period of consolidation where the price forms a small symmetrical triangle.
- Bearish Pennant: Occurs after a strong downward move, followed by a period of consolidation where the price forms a small symmetrical triangle.
- Significance: Like the Flag, the Pennant pattern signals a brief pause in the trend, with the price expected to break out in the direction of the prevailing trend. The smaller the pennant, the stronger the subsequent breakout is expected to be.
3. Rectangle
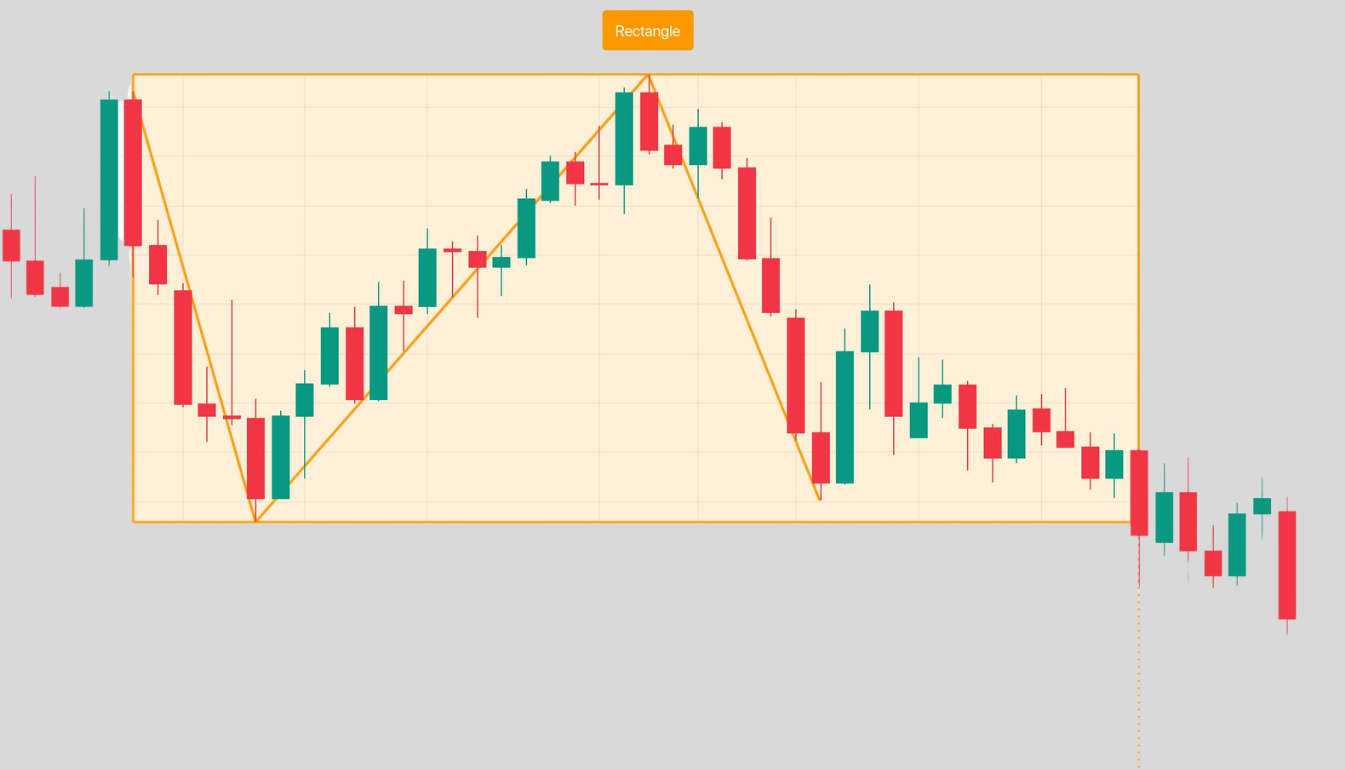
The Rectangle pattern, also known as a trading range or consolidation zone, is a continuation pattern that forms when the price moves sideways between parallel support and resistance levels for a period of time.
- Formation:
- Bullish Rectangle: Forms during an uptrend when the price oscillates between horizontal support and resistance levels, typically after a strong upward move.
- Bearish Rectangle: Forms during a downtrend when the price oscillates between horizontal support and resistance levels, typically after a strong downward move.
- Significance: A rectangle represents consolidation and can break in either direction. A breakout may indicate continuation or reversal; false breakouts also occur.
4. Triangle
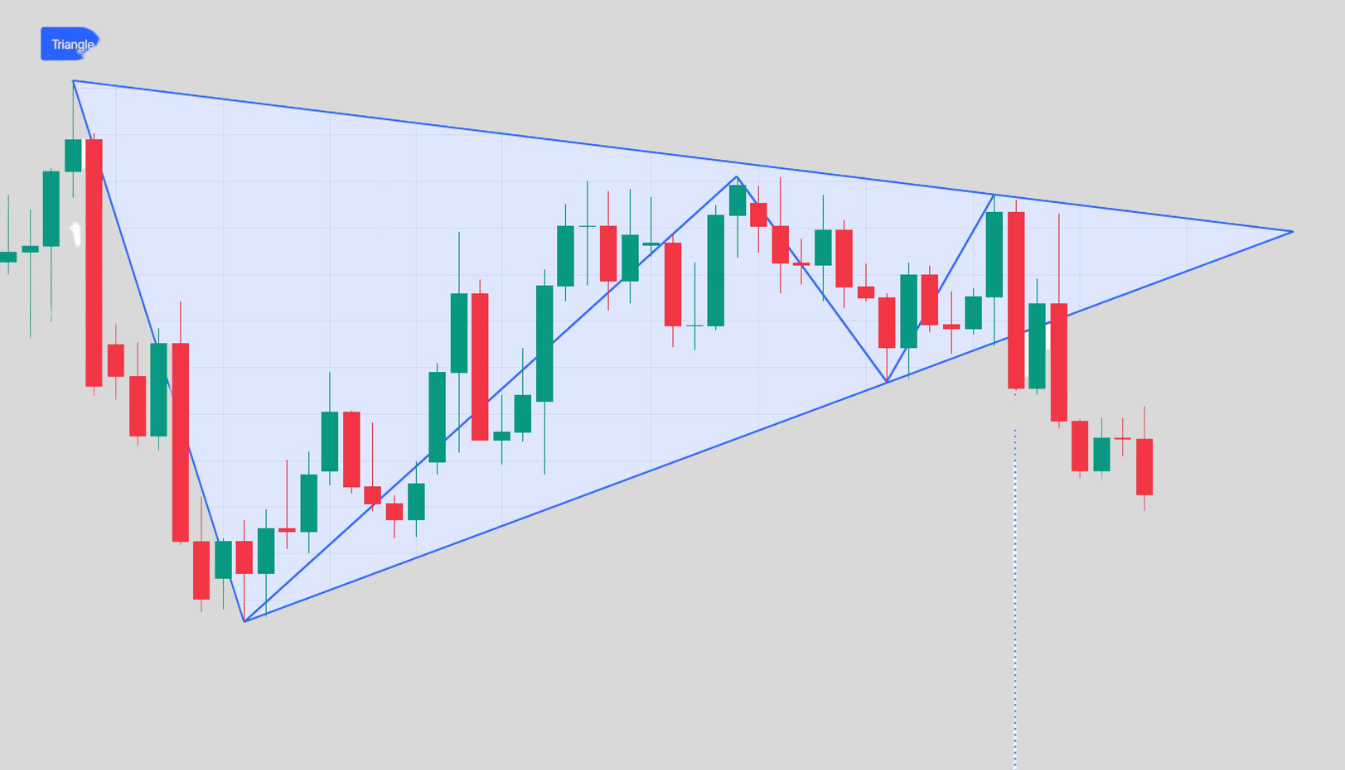
Triangle patterns form within converging trendlines and can precede either continuation or reversal; breakout direction is not guaranteed. There are three types of triangle patterns:
- Symmetrical Triangle:
- Formation: This pattern forms when the price makes lower highs and higher lows, converging into a triangle shape. It typically indicates a period of consolidation before a breakout.
- Significance: The breakout can occur in either direction, but the pattern generally favors the continuation of the prevailing trend. Traders wait for the breakout from the triangle to confirm the direction.
- Ascending Triangle:
- Formation: This pattern forms when there is a flat resistance level and rising support, creating a triangle. It typically indicates that buyers are gaining strength.
- Significance: The pattern is usually bullish, with the breakout expected to occur above the resistance level, potentially continuing an uptrend or reversing a downtrend.
- Descending Triangle:
- Formation: This pattern forms when there is a flat support level and descending resistance, creating a triangle. It typically indicates that sellers are gaining strength.
- Significance: The pattern is usually bearish, with the breakout expected to occur below the support level, potentially continuing a downtrend or reversing an uptrend.
These continuation patterns are invaluable for traders who want to trade with the trend. Recognizing these patterns allows traders to enter positions with greater confidence, as the patterns suggest that the existing trend is likely to persist. Breakout timing and direction remain uncertain, and patterns can fail.
3. Interpreting Candlestick Patterns
Interpreting candlestick patterns involves understanding the nuances of their various components—color, body size, and shadows—to make informed trading decisions. Additionally, recognizing patterns in sequences and across different timeframes adds depth to technical analysis, allowing traders to predict price movements more accurately.
3.1. Color Significance
The color of a candlestick provides immediate visual information about the market’s direction during a specific period. While different charting platforms may use varying color schemes, the most common convention is as follows:
- Green/White (Bullish): Indicates that the closing price was higher than the opening price. This color signifies bullish sentiment, suggesting that buyers were in control during the period.
- Red/Black (Bearish): Indicates that the closing price was lower than the opening price. This color signifies bearish sentiment, suggesting that sellers were in control during the period.
Understanding the color of candlesticks helps traders quickly gauge the market sentiment and determine whether to adopt a bullish or bearish outlook.
3.2. Body Size
The size of the candlestick’s body reflects the strength or weakness of the price movement within the period:
- Long Body: A long body indicates a large opening-to-closing move within that period; it does not establish a trend. A long green/white body suggests strong buying pressure, while a long red/black body indicates strong selling pressure.
- Short Body: A short body can suggest indecision; a doji specifically has equal or nearly equal opening and closing prices. Neither buyers nor sellers have taken control, which could signal a potential reversal or a continuation of the current trend after a period of consolidation.
Traders often look at the relative size of candlestick bodies to gauge the intensity of the market’s moves and to predict possible continuation or reversal scenarios.
3.3. Shadows
The shadows, or wicks, of a candlestick provide additional insight into the price action during the period. The length of the shadows indicates how far the price moved from the opening or closing price before returning to those levels:
- Long Upper Shadow: A long upper shadow indicates that the price reached a high level during the period but was pushed back down before the close. This can suggest resistance, as sellers stepped in to prevent the price from staying at its high.
- Long Lower Shadow: A long lower shadow indicates that the price dropped to a low level during the period but was pulled back up before the close. This can suggest support, as buyers stepped in to prevent the price from staying at its low.
The length and position of shadows relative to the body provide clues about potential reversals or continuations. For example, a candlestick with a long lower shadow in a downtrend might indicate that the selling pressure is waning, potentially leading to a reversal.
3.4. Combining Patterns
The power of candlestick analysis often lies in recognizing sequences of patterns and understanding their implications over different timeframes:
- Identifying Patterns in Sequences: While individual candlestick patterns provide valuable information, analyzing sequences of patterns can offer a more comprehensive view of market sentiment. For example, a Bullish Engulfing pattern followed by a Hammer could strengthen the case for a reversal in a downtrend. Conversely, a Hanging Man followed by a Bearish Engulfing pattern could signal a strong bearish reversal after an uptrend.
- Recognizing Patterns at Different Timeframes: The significance of a candlestick pattern can vary depending on the timeframe in which it appears. For instance, a Morning Star pattern on a daily chart might suggest a longer-term bullish reversal, whereas the same pattern on a 15-minute chart might only indicate a short-term bounce. Traders often use multiple timeframes to confirm the strength of a pattern and make more informed decisions.
By interpreting these various aspects of candlestick patterns—color, body size, shadows, and their sequences across different timeframes—traders can develop a more nuanced understanding of market dynamics and improve their ability to predict future price movements.
4. Using Candlestick Patterns in Trading Strategies
Candlestick patterns are more than just tools for identifying potential price movements; they can also be integral components of comprehensive trading strategies. By understanding how to apply these patterns within the context of broader market analysis, traders can make more informed decisions, improve their entry and exit points, and manage risk more effectively. This section explores various ways to use candlestick patterns in trading strategies.
4.1. Trend Identification
Identifying the prevailing trend is crucial for developing a successful trading strategy. Candlestick patterns can help traders spot trends early and align their trades with the market’s momentum.
- Spotting Trends Using Continuation Patterns: Continuation patterns like Flags, Pennants, and Triangles indicate that the current trend is likely to continue after a brief period of consolidation. For example, during an uptrend, a Bullish Flag pattern followed by a breakout to the upside signals that the upward momentum is likely to resume, providing an opportunity to enter or add to a long position.
- Identifying Trend Reversals with Reversal Patterns: Reversal patterns such as Double Tops/Bottoms, Head and Shoulders, and the Morning/Evening Star are key indicators that a trend may be nearing its end. For instance, a Head and Shoulders pattern at the top of an uptrend suggests that the trend is weakening, potentially providing an early signal to exit long positions or consider shorting the market.
4.2. Support and Resistance
Support and resistance levels are critical areas on a chart where the price tends to reverse or consolidate. Candlestick patterns can help traders identify these levels and make strategic trading decisions around them.
- Using Patterns to Identify Support and Resistance Levels: Patterns like the Hammer or Hanging Man often form at key support or resistance levels, signaling that the market is likely to reverse. For example, if a Hammer pattern forms at a well-established support level, it suggests that the support is holding, and the price may bounce higher.
- Trading at These Levels: Once support and resistance levels are identified, traders can use candlestick patterns to study possible entry and exit scenarios, whose outcomes remain uncertain. For instance, a trader might wait for a Bullish Engulfing pattern at a support level before entering a long position, with the expectation that the price will rise from that level.
4.3. Entry and Exit Points
Pattern-based entry and exit rules are hypotheses; they do not establish profitable timing and can produce losses.
- Interpreting Bullish Patterns: A Morning Star or Bullish Engulfing can suggest a potential bullish reversal, but neither identifies an optimal entry or guarantees a reversal.
- Interpreting Bearish Patterns: An Evening Star or Bearish Engulfing can suggest a potential bearish reversal, but neither identifies an optimal exit or guarantees a reversal.
4.4. Risk Management
Risk management aims to limit losses; ordinary stop-loss orders may execute beyond their trigger prices. Candlestick patterns can be instrumental in setting stop-loss levels and protecting capital.
- Using Patterns to Manage Risk and Protect Capital: Traders often place stop-loss orders based on candlestick patterns to limit potential losses. For example, if entering a long position based on a Bullish Engulfing pattern, a trader might set a stop-loss just below the low of the engulfing candle to protect against a potential reversal.
- Setting Stop-Loss Levels: By using the highs and lows of candlestick patterns as reference points, traders can set stop-loss orders at logical levels. This approach helps in minimizing losses if the trade does not go as anticipated. For example, in a Bearish Engulfing pattern, a stop-loss might be placed just above the high of the engulfing candle.
4.5. Backtesting and Optimization
Before applying any trading strategy in live markets, it’s essential to test its effectiveness using historical data. Backtesting allows traders to evaluate how well a strategy based on candlestick patterns would have performed in the past.
- Testing Strategies Using Historical Data: Traders can use backtesting to simulate trades based on specific candlestick patterns and analyze the outcomes. For instance, testing how well the Bullish Engulfing pattern predicts upward price movements over a set period can provide insights into its reliability.
- Optimizing Strategies: By analyzing backtesting results, traders can refine their strategies. This might involve adjusting the parameters for entry and exit points, changing the timeframes used, or combining candlestick patterns with other technical indicators to improve accuracy.
This section covers the practical application of candlestick patterns in developing trading strategies, focusing on trend identification, support and resistance, entry and exit points, risk management, and the importance of backtesting and optimization. By integrating these elements, traders can define rules for evaluation; historical performance does not establish future profitability.
Conclusion
Candlestick patterns are an essential tool in technical analysis, offering traders and investors valuable insights into market sentiment and potential price movements. By understanding and interpreting these patterns, market participants can make more informed decisions, improve their timing of trades, and effectively manage risk.
Incorporating candlestick patterns into your trading approach can enhance your ability to navigate the markets more effectively. Whether you are a novice trader or an experienced investor, the insights provided by these patterns can be a valuable addition to your trading toolkit, providing a framework for studying price action while leaving future outcomes uncertain.
Candlestick patterns describe historical price action and possible scenarios; they do not ensure accurate forecasts or consistent trading results.