Capital.com
- Minimum deposit
- $20
- Regulated by
- CySEC in Cyprus, FCA in the UK, ASIC in Australia
Explore indicator guides from BrokerCheck.
Why do most divergence indicators disappoint, and what does the Vdubus tool do differently?
Built to flag possible reversals, this divergence indicator is best read together with other indicators.
A straight line fitted to price can frame a trend, with a channel built around it to read entries and exits.
Volume at every price level is drawn for the part of the chart you are viewing, and the profile needs careful reading.
1. Overview of Trend Lines Trend lines are one of the foundational tools used in technical analysis, offering traders a simple yet effective way to underst
Martin J. Pring's momentum oscillator behaves differently on each timeframe, which is why its setup values matter.

The lunar cycle is an unconventional tool for a trading chart and needs careful reading plus a risk plan.
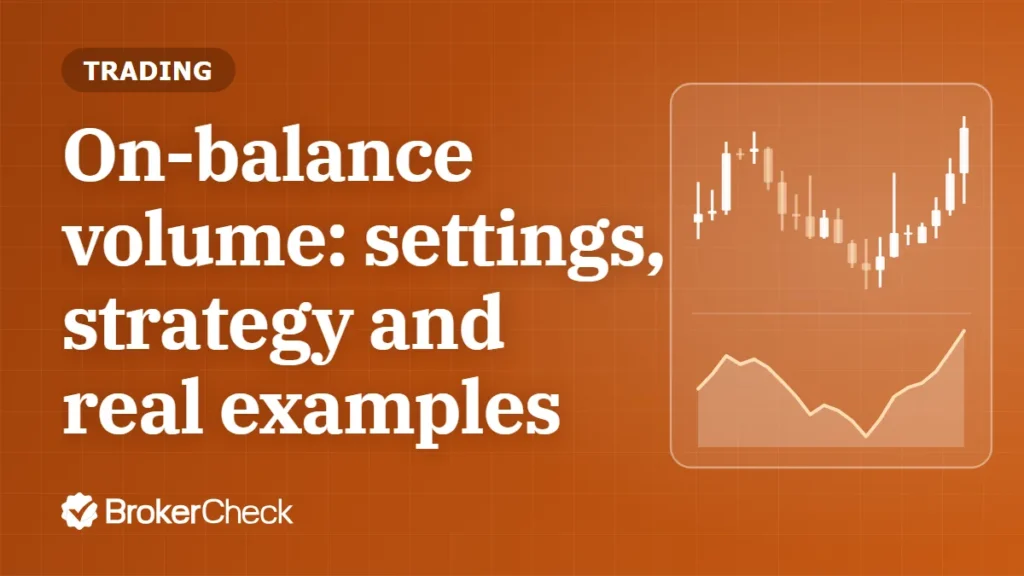
Volume adds up when the close rises and subtracts when it falls, and the line only helps if you read it with care.

Price changes weighted by volume show where volume is flowing, and the right setup depends on your timeframe.

Every candle carries a running tally of buyers and sellers, so how does it become a usable signal?

Do markets repeat the same patterns at the same time of year, and how can you check for them on a chart?

1.1. Overview Of Support And Assistant Support and Resistance (S/R) are cornerstone concepts in technical analysis, serving as the foundation for many trad

1, Landscape of Financial Scams in India The financial landscape in India, much like the rest of the world, has been significantly marred by the prevalence

1. What is OptionsTradPro.com? At first glance, OptionsTradPro.com presents itself as a cutting-edge trading platform specializing in options trading. They
Who Is Arty? Arty, known for his YouTube channel 'The Moving Average'. He creates content related to Forex and Crypto trading. While many newcomers find hi

1. Overview Of Leading Indicators Leading indicators are statistical measures that are used to forecast the future direction of economic activity, business
1. Overview Of The Lagging Indicator 1.1. What are indicators? In the complex field of finance and economics, indicators serve as vital tools that provide
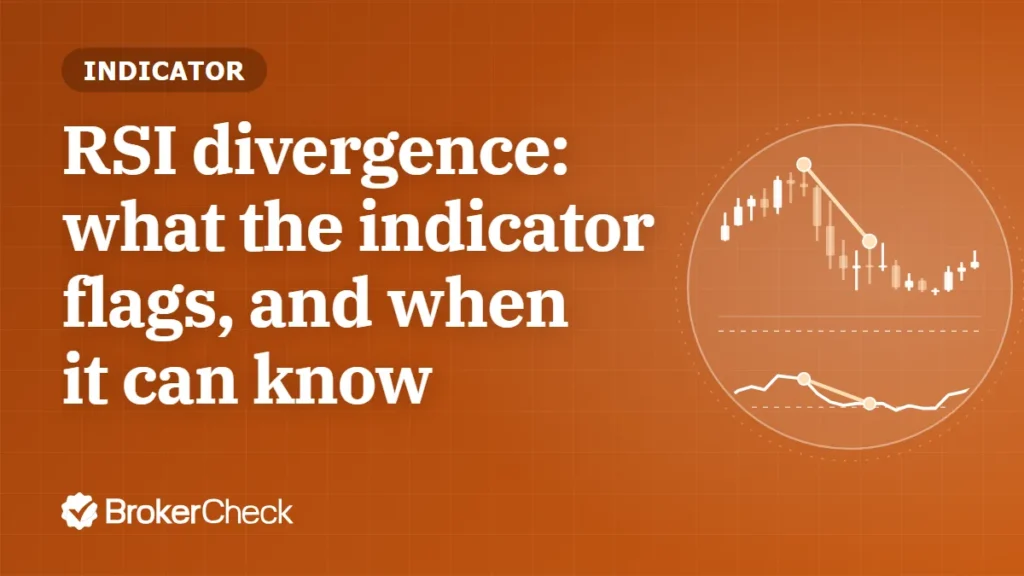
Which swings count as an RSI divergence, and how soon can the signal really be known?
1. Overview of Rob Booker's Missed Pivot Points Indicator Pivot points are a staple in the toolkit of many traders, serving as a predictive indicator of ma
1. Overview of the Relative Volume At Time Indicator The Relative Volume At Time (RVAT) indicator is a crucial tool for traders and investors, offering ins

Understanding Expert Advisors (EAs) Before you start using EAs, you need to have a basic understanding of what they are and how they function. EAs are also
1. Overview of the Relative Volatility Index (RVI) Indicator The Relative Volatility Index (RVI) is a financial indicator used by traders and investors to
1. Introduction to the Relative Vigor Index (RVI) The Relative Vigor Index (RVI) is a financial indicator used in technical analysis that measures the stre

1. Overview of the Rate of Change (ROC) Indicator The Rate of Change (ROC) is a momentum-based technical indicator used in financial markets to measure the

1. Overview of Price Oscillator 1.1 Definition and Basic Concept The Price Oscillator, a fundamental tool in technical analysis, is used by traders to gaug

1. Overview of the Open Interest Indicator The Open Interest (OI) indicator is a fundamental tool used in the financial markets, particularly valuable in t

1. Overview of the Weighted Moving Average (WMA) The Weighted Moving Average (WMA) is a crucial technical indicator in financial analysis, especially in th

1. Overview of the Median Indicator The Median Indicator is a statistical measure used in financial analysis to identify the middle value in a data set. Wh

1. Overview of the Momentum Indicator The Momentum Indicator, a tool widely used in technical analysis, offers traders insights into the speed or strength
1. Overview of the MA Cross Indicator The Moving Average Cross (MA Cross) indicator is a fundamental tool in financial technical analysis, widely used for

1. Overview of the Donchian Channels Indicator 1.1 Introduction to Donchian Channels The Donchian Channels Indicator, developed by Richard Donchian, is a p

1. Overview of the Gaps Indicator 1.1 What are Gaps? Gaps are a common occurrence in financial markets, often observed in stock, forex, and futures trading

1. Overview of the Envelope Indicator The Envelope Indicator, a prominent tool in technical analysis, serves as a method to identify potential overbought a
1. Overview of Historical Volatility Indicator 1.1 What is Historical Volatility? Historical Volatility (HV) is a statistical measure of the dispersion of

1. Overview of the Klinger Oscillator Indicator The Klinger Oscillator is a technical analysis indicator used to determine long-term trends in the money fl
1. What Is Auto Fibonacci Retracement 1.1. Overview of Fibonacci and Its Relevance in Trading Fibonacci retracement is a popular tool among technical trade
1. Introduction to Directional Movement Index (DMI) 1.1 What is the Directional Movement Index? The Directional Movement Index (DMI) is a technical analysi
1. Overview of Bollinger Bands Width 1.1 Introduction to Bollinger Bands Bollinger Bands are a popular technical analysis tool developed by John Bollinger

1. Overview of Bollinger Bands %B Indicator 1.1 Introduction to Bollinger Bands %B Bollinger Bands %B is a technical analysis tool invented by John Bolling
1. Introduction of the Auto Fibonacci Extension Indicator 1.1 Introduction to Fibonacci and Its Relevance in Trading The Fibonacci sequence, named after th
1. What is the Advance Decline Line? The Advance Decline Line (ADL) is a technical analysis tool used to illustrate market breadth. It represents the cumul
1. What is the Up/Down Volume Ratio? The Up/Down Volume Ratio is a market sentiment indicator used by traders to understand the buying and selling pressure
1. What is Time Weighted Average Price? Time Weighted Average Price (TWAP) is an algorithmic trading strategy that aims to execute trades at an average sec
1. What is TRIX? TRIX is a momentum oscillator that stands for Triple Exponential Average. It was developed by Jack Hutson in the early 1980s and is design
1. What is the Advance Decline Ratio? The Advance Decline Ratio (ADR) is a market breadth indicator used by traders to gauge the overall health of the mark

1. What Are the Best Indicators for Forex Trading? The Forex market is full of numerous indicators. Traders have even made their own individual indicators

1. What Are TradingView Indicators? Best TradingView indicators are mathematical calculations plotted on the price chart of financial instruments. They are

1. The 3 Best cTrader Indicators cTrader indicators are analytical tools used on the cTrader trading platform to assist traders in making informed decision
1. What Are The Best MetaTrader 5 Indicators? When it comes to MT5 indicators, you can see they are almost identical to that of MT4. However, the exact dif

1. What are the Best Metatrader 4 Indicators? Many free Metatrader 4 indicators provide powerful tools to improve trading strategies. With so many forex in

1. What Defines a Profitable Forex Strategy? A profitable Forex strategy hinges on its ability to consistently yield positive returns over time. Key to thi
1. What is Chande Forecast Oscillator? The Chande Forecast Oscillator (CFO) is a momentum indicator developed by Tushar Chande, designed to predict future

1. What is Parabolic SAR? The Parabolic SAR (Stop and Reverse) is a technical analysis indicator, developed by J. Welles Wilder Jr., designed to identify p
1. What is the Volatility Stop Indicator? The Volatility Stop Indicator is a technical analysis tool used by traders to determine stop-loss levels. It inco
1. What are Multi Time Period Charts? Multi Time Period Charts are advanced trading tools that display price action across various time frames simultaneous

1. What is the Money Flow Index? The Money Flow Index (MFI) is a technical indicator that gauges the strength of money inflow and outflow over a specified
1. What is the Mass Index Indicator? The Mass Index Indicator is a technical analysis tool designed to identify trend reversals by measuring the range betw
1. What is McGinley Dynamic Indicator? The McGinley Dynamic Indicator is a technical analysis tool developed by John R. McGinley, a market technician, in t

1. What is Moving Average Ribbon? A Moving Average Ribbon is a technical analysis tool composed of multiple moving averages of different lengths plotted on

1. What Is the Supertrend Indicator? The Supertrend Indicator is a popular technical analysis tool used by traders to determine market trends and potential
1. What Are Keltner Channels? Keltner Channels are a type of technical analysis tool traders use to identify potential trend directions and volatility in t

1. What Is the Hull Moving Average? The Hull Moving Average (HMA) is a technical indicator created by Alan Hull to improve upon the lag and responsiveness

1. What is the Least Squares Moving Average? The Least Squares Moving Average (LSMA) , also known as the End Point Moving Average , is a type of moving ave

1. What is the SMI Ergodic Oscillator? The SMI Ergodic Oscillator is a technical analysis tool used by traders to identify trend direction and strength. It

1. What is the SMI Ergodic Indicator? The SMI Ergodic Indicator is a technical analysis tool used to identify the direction of price momentum and potential
1. What is Stochastic RSI? Understanding Stochastic RSI Dynamics The Stochastic RSI (StochRSI) operates on the principle that in a bullish market , prices

1. What is the Ultimate Oscillator? In the realm of trading, the divergence between the Ultimate Oscillator and price action is a crucial signal for trader

1. What is the True Strength Index (TSI)? Understanding TSI Signals Overbought and Oversold Conditions: Overbought : When TSI exceeds a certain upper thres

1. Understanding Volume Weighted Moving Average (VWMA) When analyzing the VWMA, traders often look for crossovers with other moving averages, such as the S
1. What Is Triple EMA? When incorporating the Triple EMA into a trading strategy, it is essential to understand its components and how they interact with m
1. Overview of the Volume Oscillator 1.1 What is the Volume Oscillator? The Volume Oscillator is a technical analysis tool that measures the difference bet
1. Understanding the Vortex Indicator To effectively incorporate the Vortex Indicator into trading strategies, it's essential to understand its key signals
1. Understanding VWAP and Its Significance in Trading Incorporating VWAP into a trading strategy often involves several tactical approaches: Trade Executio
1. Understanding the Williams Alligator Indicator Traders employ the Williams Alligator Indicator as part of a larger trading system, often in conjunction
1. Understanding Williams Fractals in Trading Incorporating Williams Fractals into a trading strategy typically involves looking for the formation of fract

1. Understanding Woodies CCI Indicator Woodies CCI is not just a single indicator but a suite of several patterns and signals that traders use to make info
1. Understanding Williams %R Indicator Williams %R operates on the premise that as prices increase, closes tend to occur nearer to the high of the recent p
Explore the DMI Formula & Strategy essentials for astute traders. Channel your skills to amplify returns 💡📈.

Unearth the nuances of the Elder Force Index. Explore its formula, and elevate your trading strategy. 📈💰

Master the Fisher Transform trading strategy! Unleash the winning formula for optimized trading profits 📈💰.
1. What is Pine Script? Pine Script is a specialized, domain-specific language engineered specifically for creating custom technical indicators, strategies
1. Introduction to Pine Script Pine Script is a domain-specific programming language primarily used for creating custom technical analysis indicators, stra
Unravel the secrets of DEMA: its formula, settings, strategy, and more. Elevate your forex, crypto, or CFD trading today! 📈💰
Unlock trading success with Ease of Movement! Learn the formula, settings & strategy today. 📈💰
Dive into the world of forex with our guide on Divergence Indicator: Formula, Settings, Strategy.💹📈

Unleash your trading potential! Learn how to use Donchian Channels to maximize your forex, crypto and CFD profits 💹📈

Unlock trading success with Pivot Points! Dive into settings, formulas, and strategies for maximum profit. 📈💰

Master the Chop Zone Indicator with our easy guide. Learn to identify market trends and make profitable trades. 💹📈
Master Bollinger Bands! Uncover settings, formula, strategy for profitable trades. Trade smarter, not harder. 📈💰

Unlocking Trading Success: Dive deep into volume indicators. Learn strategies to optimize trades and boost profits 📈💰
Unlock the secrets of successful trading with Chaikin Money Flow. Master the art of profit-making today! 💹💰

An average that reacts faster to recent closes is easy to misread as a forecast, and the 9 EMA is a common example.

Dive into the world of trading with our easy-to-follow guide on Ichimoku Cloud! Get savvy, trade smart! 📈💡

Unravel the secrets of Moving Averages: Types, Strategies, Errors. Boost your trading game today! 📈💰
Master the art of trading with our guide on using Fibonacci successfully. Boost profits today! 💹📈

Master the art of trading with our comprehensive guide on Simple Moving Average. Get ahead in the market today! 📈💰

Unlock trading success with our guide on using the Chande Momentum Oscillator effectively. Master the markets today! 📈💰

Unlock the path to trading success with our guide on Connors RSI. Boost your trading skills today! 📈💰

Discover the top trading oscillators to maximize your trading profits. Get the edge in market trends today! 💹📈

Unearth the top momentum indicators for successful trading! 📈🚀 Unlock your trading potential with our expert guide!

Discover the top volatility indicators, your secret weapon for mastering the trading game. 💹📈
Unlock your trading potential with our guide on how to use the Average True Range (ATR) effectively! 📈💰

Master the Average Day Range for successful trading! Our guide simplifies the process, helping you make smarter moves.📈💰

Unlock the secrets of the Detrended Price Oscillator! Our guide simplifies its use for successful trading strategies. 📈💰

Unlock the secrets of the Chaikin Oscillator! Our guide helps traders use it successfully for profitable trades. 📈💰

Master the Awesome Oscillator with our easy guide. Learn to predict market trends and boost your trading success! 💹📈

Master the Balance of Power trading strategy with our easy guide! Maximize profits, minimize risks. 📈💰
Master the Commodity Channel Index with our comprehensive guide. Trade smarter, not harder, with our proven strategies. 💹📈

Master the Coppock Curve! Uncover secrets of successful trading with this powerful tool. Boost your profits today! 💹💰

Master the Average Directional Index with our easy guide! Unearth trading opportunities like never before. 📈💰
Unlock the secrets of successful trading with our guide on using the 24-hour volume. Learn, grow, trade! 💼📈

Learn the secrets of using the Auto Pitchfork for successful trading. Master the market trends now! 📈💰
Master the art of using Accumulation/Distribution successfully in trading. Boost your profit game today! 📈💰
Unlock the secrets of successful trading with our comprehensive guide on using the RSI effectively. Profit awaits! 💹📈
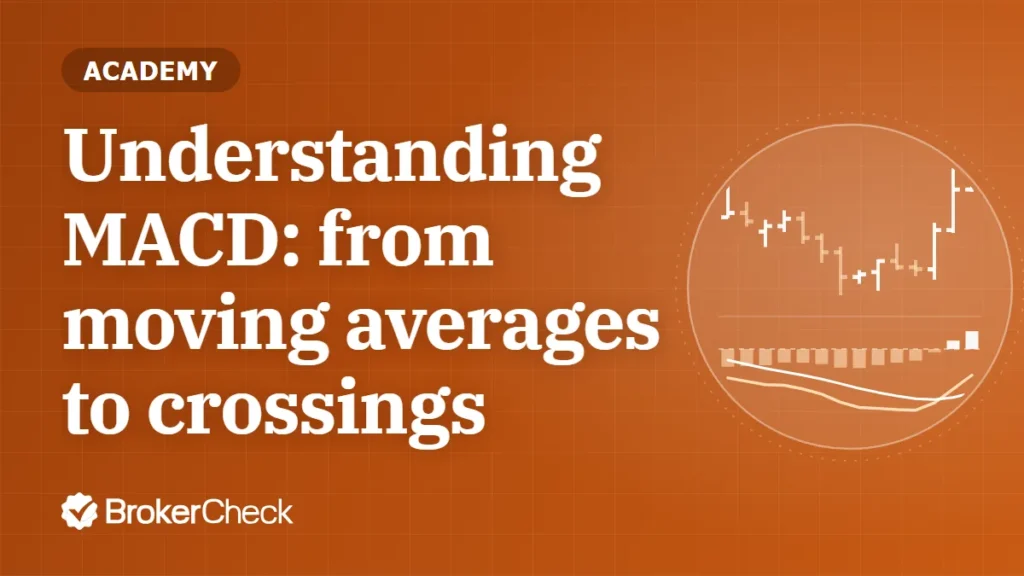
Where do the MACD crossings traders watch actually come from?

1. Understanding the Power of Trading Indicators Trading indicators are powerful tools that traders utilize to interpret market information and guide their

Unleash your trading potential with our guide on using Bull Bear Power. Boost profits, mitigate risks now! 🐂🐻

Whether you are just starting to trade the Forex market or you are a seasoned professional, there are many different indicators you can use to increase you
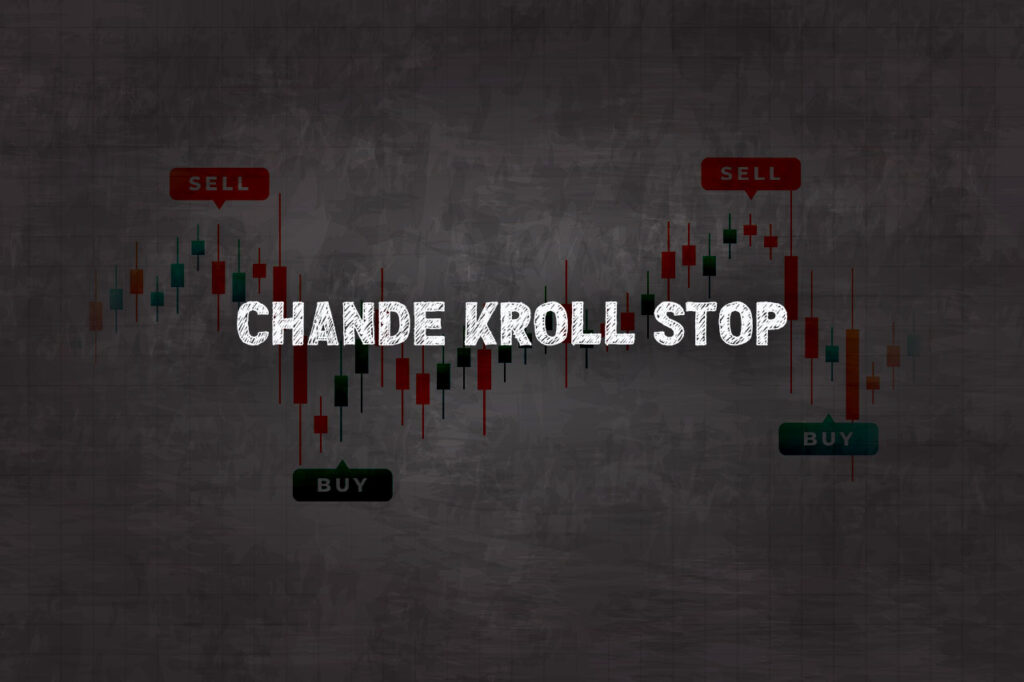
What is the Chande Kroll Stop? The Chande Kroll Stop is a volatility-based indicator developed by Tushar Chande and Stanley Kroll. It is designed to set st