An order block is a price zone that a trader marks on a chart, usually the range of the last candle before a sharp move. The idea is that price may react when it returns to that zone. This guide gives the idea a precise, testable definition, shows two real examples, and reports what happened to 241 such zones on 5,000 hourly EURUSD candles, next to ordinary pairs of opposite candles that fail the rules. Among zones that price returned to and that reached a decided outcome, 49.7% of the order-block zones held, compared with 44.9% of the ordinary pairs.
What an order block is
The term is used in smart money concepts (SMC) chart analysis and is associated with the teaching of the Inner Circle Trader (ICT). Definitions and drawing rules vary among traders. Most versions agree on three points.
- Bullish order block: the last down candle before an upward move that breaks recent highs. Its price range becomes a zone where buyers may step in again.
- Bearish order block: the last up candle before a downward move that breaks recent lows. Its range becomes a zone where sellers may step in again.
- The reaction idea: the story is that a large participant left unfilled orders in that zone, so price may bounce when it comes back. Retail chart data does not show anyone’s orders, so the explanation itself is an assumption about order flow. What a chart can show is whether price behaves differently around such zones.
Versions differ on the details. Some traders mark the whole candle from high to low, some only the body, some only the half of the candle nearest the move. Some require a break of structure, some require a gap or a fast series of candles. Because nothing is standard, any claim about order blocks only makes sense once the rule is written down. That is what the next section does.
The convention used on this page
The rules below are one reasonable way to turn the idea into something a computer can check. Other traders draw them differently. ATR is the average true range, a measure of recent volatility. Here it uses Wilder’s 14-candle smoothing and is fixed at the marker candle for both strength and outcome tests. True range is the largest of high minus low, the absolute difference between high and the previous close, and the absolute difference between low and the previous close. For the first candle, true range is high minus low. The first ATR is the mean of the first 14 true ranges; each later value is (previous ATR × 13 + current true range) / 14. Candles without an available ATR are skipped. See the glossary for the term.
| Step | Bullish order block | Bearish order block |
|---|---|---|
| Marker candle | A down candle, followed directly by an up candle | An up candle, followed directly by a down candle |
| Break | Within the next 3 candles, one closes above the highest high of the 10 candles ending with the marker | Within the next 3 candles, one closes below the lowest low of the 10 candles ending with the marker |
| Strength | The highest high of those 3 candles is at least 2 ATR above the marker candle’s low | The lowest low of those 3 candles is at least 2 ATR below the marker candle’s high |
| Zone | The marker candle’s range, low to high | The marker candle’s range, low to high |
| Still valid | The third candle after the marker closes above the zone | The third candle after the marker closes below the zone |
| Return | In the 100 candles after the third candle following the marker, the first whose high-to-low range touches or overlaps the zone | In the 100 candles after the third candle following the marker, the first whose high-to-low range touches or overlaps the zone |
| Held | Within 12 candles, counting the return candle, a close at least 1 ATR above the zone comes before any close below it | Within 12 candles, counting the return candle, a close at least 1 ATR below the zone comes before any close above it |
| Broken | A close below the zone comes first | A close above the zone comes first |
A zone that does neither within 12 candles is counted as undecided. Closes decide the outcome, not wicks: a wick that pokes through the zone but closes back inside does not break it. Within each group separately (order blocks and controls), zones are processed in marker-candle order, combining bullish and bearish zones. A zone is dropped if its marker is within 3 candles of the most recently retained marker. This reduces repeated counting of nearby setups but does not remove all overlap.
Two real examples
Both charts use real one-hour candles exported from MetaTrader 5. They were picked because the outcome is easy to see, not because they are typical. The study in the next section uses every zone the rules found.
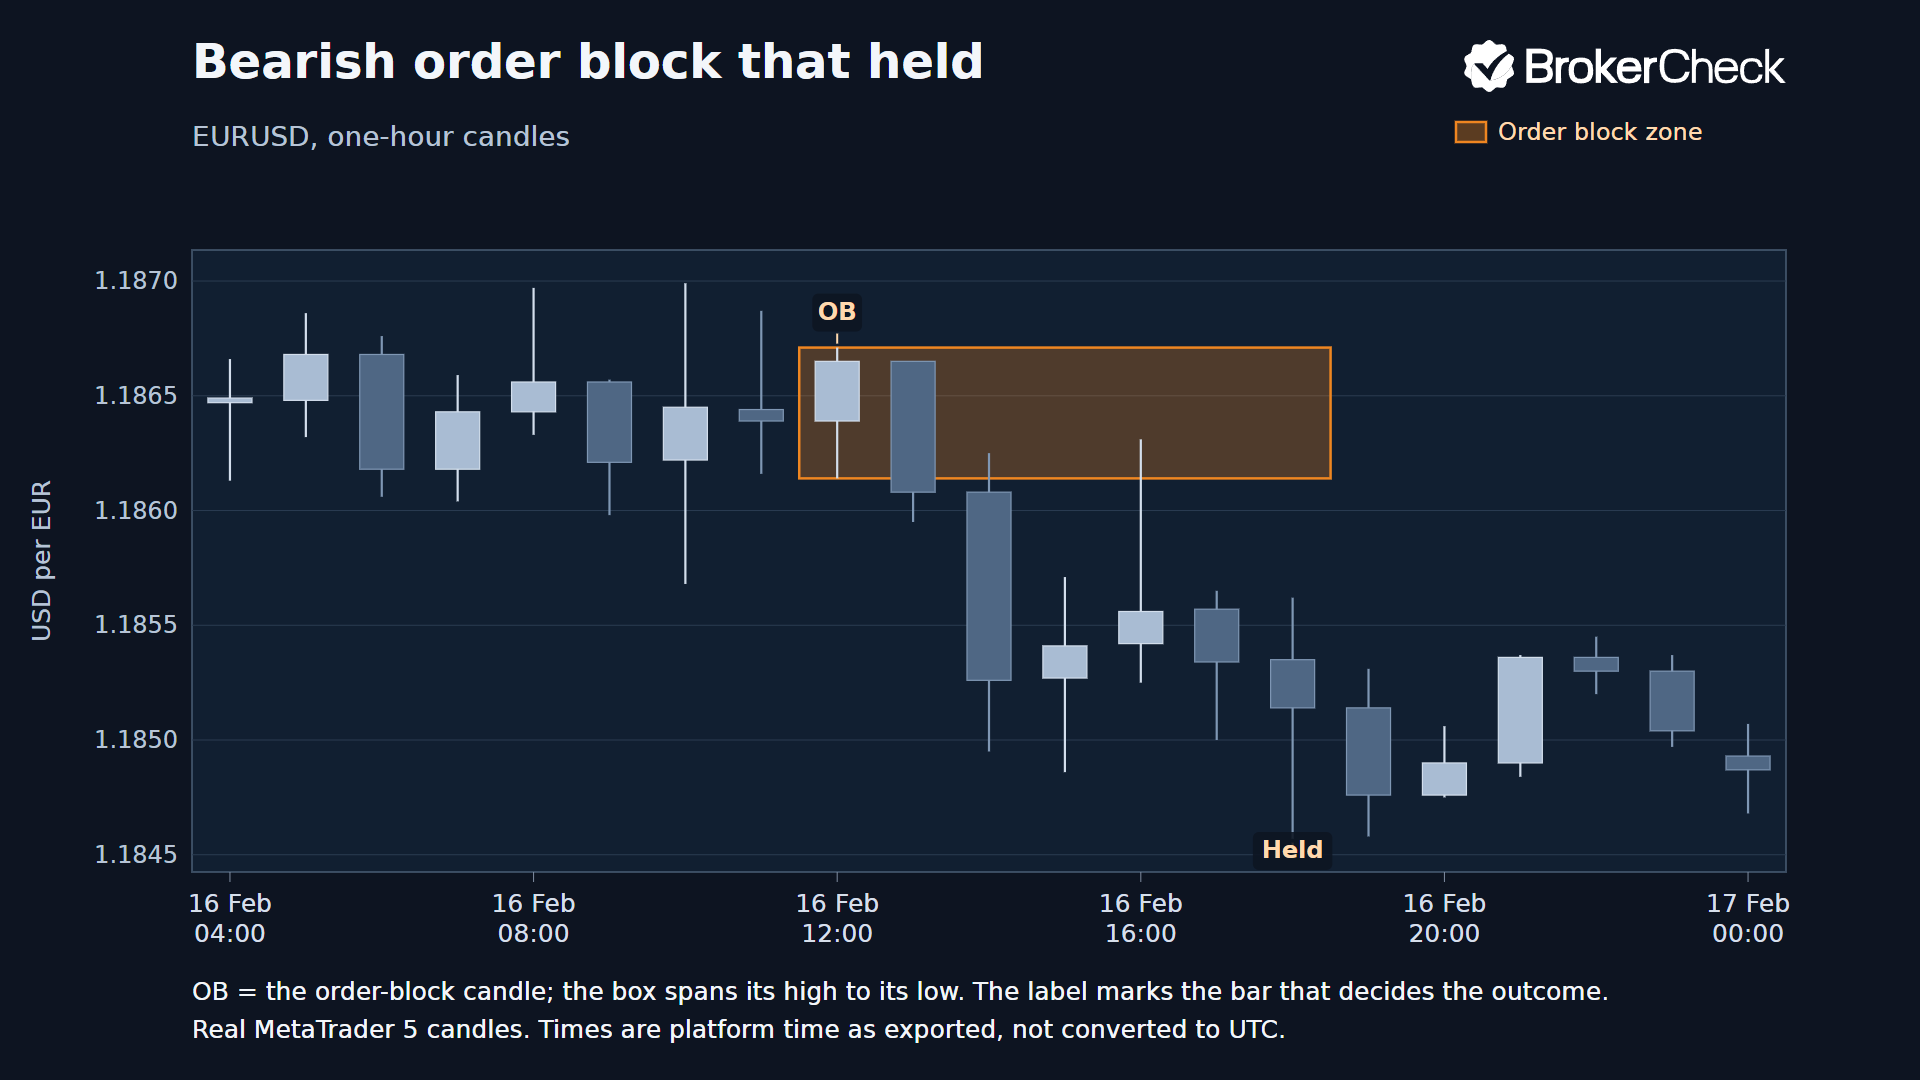
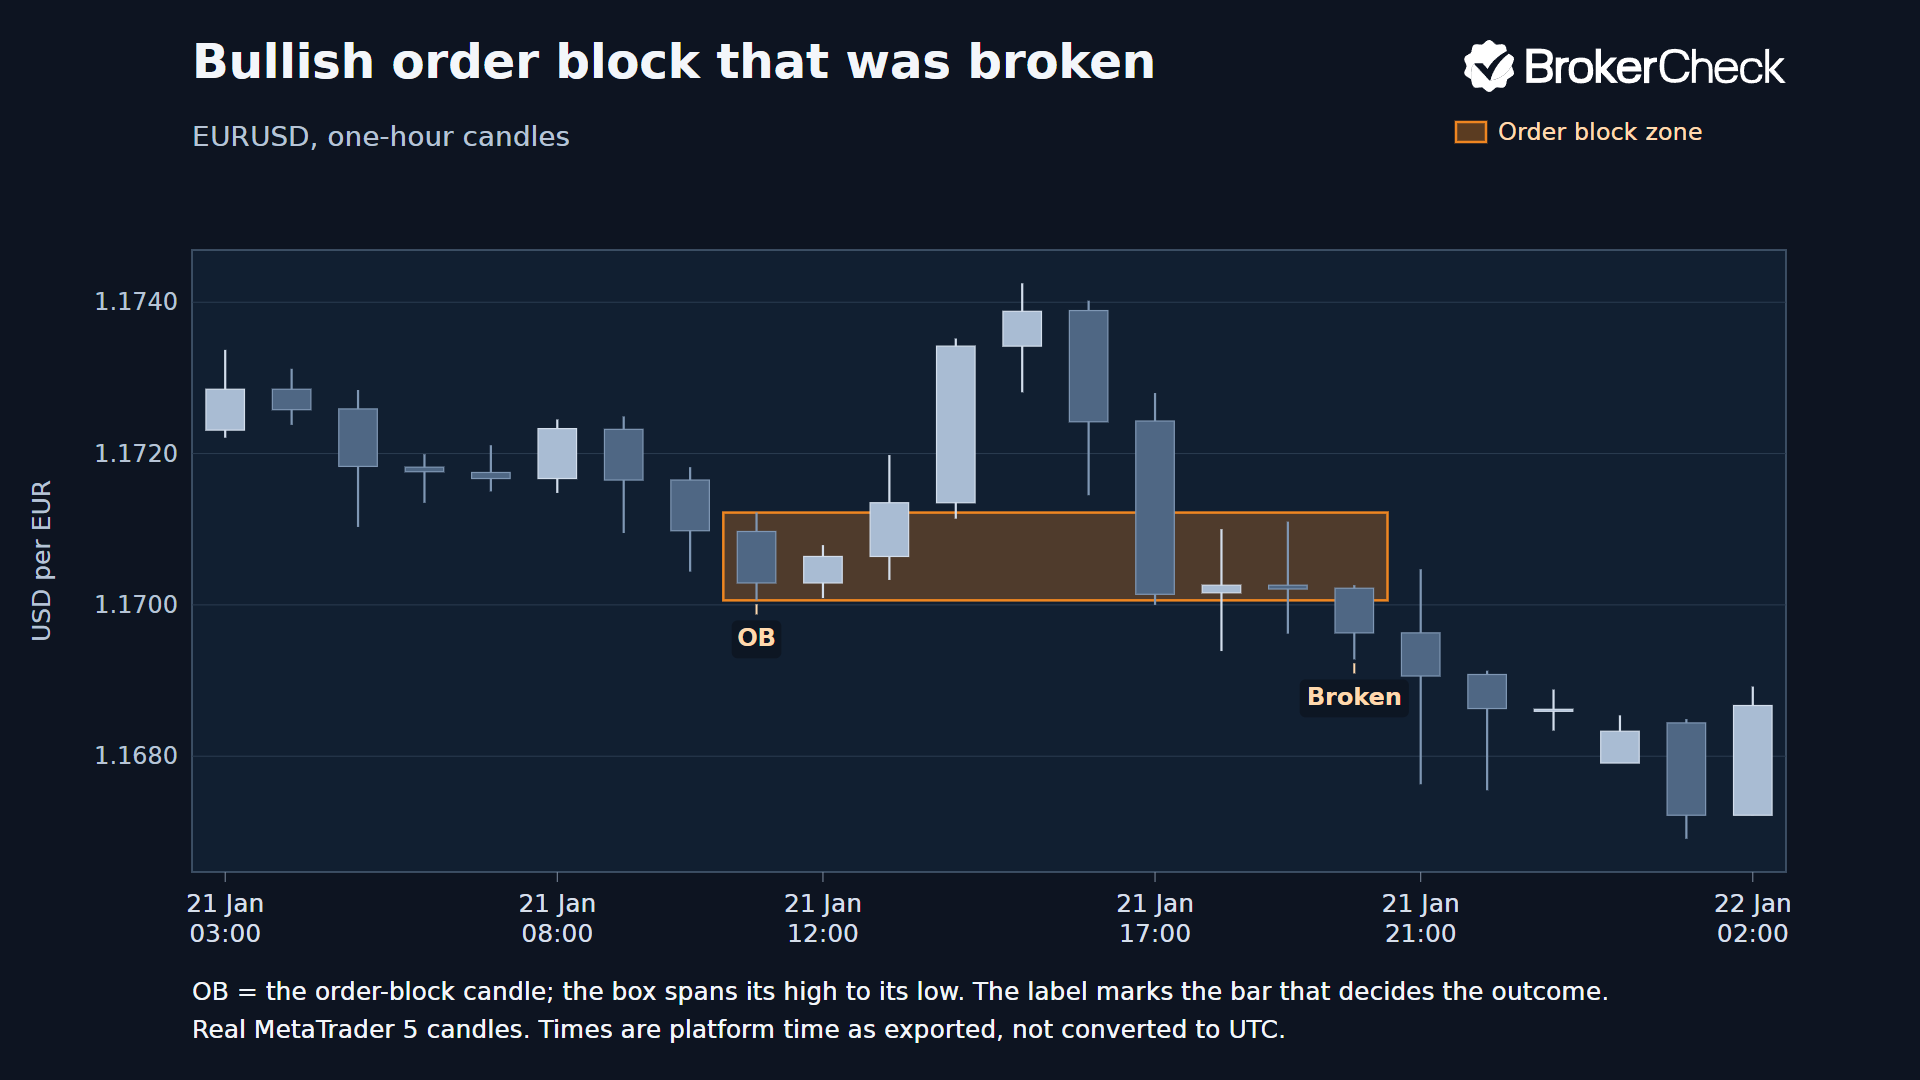
Look at what the second chart shows. Price did not bounce cleanly. Three candles closed inside the box, although their lows crossed its lower edge, before the first close below it. The zone was about 0.93 of the marker candle’s ATR wide. An actual stop distance would depend on the entry price and stop rule; neither was modelled here.
What 5,000 hourly candles show
The rules above were applied to every candle of a MetaTrader 5 export of EURUSD one-hour candles, 5,000 candles from 4 December 2025 to 24 September 2026. The control group is every pair with the same two-candle shape (a down candle then an up candle, with price still above the zone three candles later, and the mirror image for bearish zones) that fails the break test, the strength test or both. Both groups are judged by exactly the same return and outcome rules.
| Order-block zones | Control zones | |
|---|---|---|
| Zones found | 241 | 536 |
| Observed return within available history, up to 100 candles | 199 (82.6%) | 505 (94.2%) |
| No observed return, with fewer than 100 follow-up candles available | 1 | 2 |
| Held | 91 | 203 |
| Broken | 92 | 249 |
| Undecided after 12 candles | 16 | 53 |
| Held, as a share of decided zones | 49.7% (95% interval 42.6% to 56.9%) | 44.9% (95% interval 40.4% to 49.5%) |
Read it plainly. Among order blocks that price came back to and that were then decided, about half held and about half broke. The control group had a lower held share, 44.9% against 49.7%, and the two intervals overlap. These descriptive results do not establish whether the groups differ, and overlapping intervals do not establish that they are equivalent.
Does the result depend on the settings?
The thresholds are choices, so the same data was run with other choices. The share of held zones moves a lot with the definition of “held”, and so does the control group, which keeps the gap between them small.
| Variant | Order-block zones | Held share, order blocks | Held share, control |
|---|---|---|---|
| As described above | 241 | 49.7% | 44.9% |
| Strength test 1.5 ATR | 304 | 48.1% | 44.6% |
| Strength test 3 ATR | 120 | 50.6% | 44.7% |
| Held means a close 0.5 ATR beyond the zone | 241 | 56.5% | 56.4% |
| Held means a close 2 ATR beyond the zone | 241 | 31.3% | 28.4% |
| Outcome window 24 candles | 241 | 50.0% | 45.5% |
| Outcome window 6 candles | 241 | 49.7% | 42.9% |
The observed gap ranges from 0.1 to 6.8 percentage points across these settings, and the separately calculated intervals overlap in every case. This comparison does not establish equivalence or a trading advantage.
What this test does not cover
- One currency pair, one timeframe and about nine months of data. Other markets, other timeframes and other periods can look different.
- These Wilson 95% intervals assume independent outcomes. Nearby zones can share price moves and outcome windows even after thinning, so the intervals may be too narrow. The size of that effect has not been estimated.
- “Held” is a statement about candle closes, not about profit. No entry price, stop, target, spread, commission or slippage was modelled, and no trading profit or loss was measured.
- The control group is not a perfect baseline. Its zones are revisited much sooner, which changes when the outcome is measured.
- Marking by eye can pick zones the rules would not, and the reverse. These rules use fixed numerical thresholds.
How traders read a zone in practice
None of the following was tested above. They are common habits, listed so you can test them yourself.
- Higher timeframe first. Many traders mark zones on a higher timeframe and only look for them on a lower one when the direction agrees. Whether that adds anything is for your own testing to show.
- Zone width against ATR. If an entry is at one edge of a zone and a stop is beyond the opposite edge, a wider zone increases the stop distance. With the same planned cash risk, that means a smaller position; the position size calculator shows the effect.
- Closes over wicks. Treating a close beyond the far edge as the end of the idea, rather than a wick, is a common rule and the one used here.
- First return only. Many traders trust the first return more than later ones, on the view that a zone is “used up” once visited. The study above looked only at the first return.
- Breaker blocks. When a zone fails, some traders flip it and expect it to act as the opposite kind of zone on a later retest. A broken bullish order block becomes a possible resistance area. The broken zones counted in the table are the raw material for that idea, which was not tested.
- Costs near the zone. News and thin trading can widen the spread and cause slippage exactly when price reaches a zone.
Order blocks and similar ideas
An order block is close to a supply and demand zone. The difference is mostly in how the zone is drawn: a supply or demand zone usually covers a small cluster of candles before a strong move, while an order block is usually one candle. A fair value gap is a different structure: a three-candle imbalance in which the first and third candles do not overlap. Traders often look at where the two sit together. Support and resistance can be marked from prior swing highs or lows, repeated turning areas or round numbers; see the glossary for the terms.
Candle vocabulary matters when you mark zones. If a term such as body, wick or engulfing is unfamiliar, the candlestick patterns guide explains how single candles and short sequences are read.
Using zones inside a written plan
- Write the marking rules down, as the table above does, so that two people marking the same chart get the same zones.
- Decide the invalidation before the trade. A close beyond the far edge of the zone is the rule used here; a fixed stop is another.
- Size the position from the risk you accept, not from the zone. The position size calculator and the risk management guide cover the arithmetic.
- Check the reward against the risk with the risk-reward calculator before you place the order.
- Record each trade in the trading journal, including the zones you skipped.
- Test the rules on a long history and on more than one market, with costs included. The backtesting guide sets out how.
- Practise in real time without risking money first. See paper trading.
What this page establishes
- A written rule can find order blocks mechanically, and the examples show how they look on real candles.
- In this sample, 91 of 183 decided order-block zones held (49.7%), compared with 203 of 452 decided control zones (44.9%). These counts exclude zones with no observed return and those still undecided.
- No evidence was found here that a zone, by itself, gives an edge. Nothing here shows that it does not on other data or with other rules.
Risk warning. Trading involves risk, and you can lose money. Order blocks are a way of marking a chart, not a prediction of price. The examples and the study describe past candles; they are not trading signals, and nothing on this page promises a result.
Frequently asked questions
Do order blocks work?
That depends on the definition, the market, the timeframe and the costs. Among zones that price returned to and that reached a decided outcome, 49.7% of order-block zones held, compared with 44.9% of control zones. No entry rule or profit was tested, so nothing here shows whether trading them pays.
Which candle is the order block?
In this guide it is the last down candle before an upward move that breaks recent highs, or the last up candle before a downward move that breaks recent lows. Other traders use a different candle, a group of candles or a part of the candle.
Should the zone cover the whole candle or only the body?
There is no standard. Using the full high-to-low range can give a wider zone than using the body alone. A wider zone implies a wider stop distance only if the entry and stop-placement rules make it so. The wicks show the candle’s extremes; they do not reveal unfilled orders. A test needs one consistent boundary rule.
What is the difference between an order block and a supply or demand zone?
Mostly the way the zone is drawn. A supply or demand zone usually spans the small cluster of candles before a strong move, while an order block is normally a single candle. Both rest on the same idea of unfilled orders left behind.
What is a breaker block?
A breaker block is an order block that failed. When price closes through the zone, some traders turn it around and expect it to act as the opposite kind of zone on a retest. It is a trading idea, not a tested result.
Do order blocks work on other timeframes or markets?
This page tested one currency pair on one timeframe, so it cannot say. The method can be rerun on any market for which you have candle data.
How can I practise marking order blocks?
Mark them on past charts, then step forward candle by candle and note the outcome. After that, practise in real time on a demo account. See the paper trading guide.