
Technical indicators / RSI divergence
A divergence tool looks simple: price makes a new extreme and RSI does not. The useful questions are which swings count, which RSI you are reading, and how many bars must close before the tool can know. This page answers them with exact rules, real hourly charts and code you can check.
What RSI measures
The Relative Strength Index compares the average size of recent up-moves with the average size of recent down-moves and scales the result between 0 and 100. According to the MT5 help, Wilder recommended 14 periods when he introduced the index, and 9-period and 25-period versions have since gained popularity. The same help notes that RSI usually tops above 70 and bottoms below 30. MT5 help: RSI
In this download the 30 and 70 lines are drawn for orientation only. No divergence is filtered by them. Code
What a divergence compares
A divergence compares two price swings with the RSI readings at the same two bars. The MT5 help describes it as a new price high or low that RSI does not confirm with a new high or low of its own. This download turns that description into exact patterns: MT5 help: RSI
- Regular bearish: a higher swing high in price, with a lower RSI at the second high.
- Regular bullish: a lower swing low in price, with a higher RSI at the second low.
- Hidden bearish (off by default): a lower swing high, with a higher RSI at the second high.
- Hidden bullish (off by default): a higher swing low, with a lower RSI at the second low.
This page does not test whether price reverses after a divergence. It shows what the rules flag, when they can flag it, and real cases in which price moved past the second swing anyway. Chart data
How this download calculates RSI
The indicator uses closing prices and Wilder smoothing. Each bar’s price change is split into a gain and a loss, one of which is always zero, and both are smoothed. Bars are counted from the oldest loaded bar, starting at zero:
change[t]  = Close[t] − Close[t−1]
gain[t]    = max(change[t], 0)        loss[t] = max(−change[t], 0)

Seed at bar N:
AvgGain[N] = (gain[1] + … + gain[N]) / N
AvgLoss[N] = (loss[1] + … + loss[N]) / N

Later bars:
AvgGain[t] = (AvgGain[t−1] × (N − 1) + gain[t]) / N
AvgLoss[t] = (AvgLoss[t−1] × (N − 1) + loss[t]) / N

RSI[t]     = 100 − 100 / (1 + AvgGain[t] / AvgLoss[t])
N is the period, 14 by default. The smoothing step is the smoothed moving average from the MT5 help: the previous average times N − 1, plus the new value, divided by N. The MT5 RSI help gives the final formula but does not say which average to use, so this page states the one the code uses. MT5 help: smoothed moving average MT5 help: RSI Code
Seed and warm-up
The first average gain and loss are the simple means of the first 14 changes, so the first RSI value needs 15 closes. In this export it falls on the 2025-12-04 22:00 bar and equals 42.78. Earlier bars stay empty, and with 14 or fewer bars the indicator draws nothing at all. Code Values used on this page
The seed fades but never quite disappears. Each step keeps (N − 1) / N of the previous average, so 100 bars later the seed still carries a weight of about 0.06% in each average. An RSI that starts from a different first bar or seeds differently therefore shows different values at first. With the same closes and the same smoothing, the gap between the averages shrinks by that factor on every bar. Values used on this page
When nothing moves
If the average loss is zero, the formula would divide by zero. The code returns 100 when the average gain is positive and 50 when both averages are zero, which means that price has not moved at all. With an average gain of zero and a positive average loss, the formula itself gives 0. Code
The real data never reached these cases: none of its 4,986 RSI values is exactly 0, 50 or 100. Synthetic flat and one-way price series in the test cover them instead. Cross-check
Compare like with like. Two RSI lines only match when the closes, the period, the smoothing, the seed and the first bar match. Two divergence lists also need the same pivot and pairing rules.
How the indicator finds a divergence
Swing pivots
A bar is a pivot high when its high is strictly above the highs of the 5 bars before it and not exceeded by the highs of the 5 bars after it. A pivot low mirrors the rule on the lows:
Pivot high at bar p:  High[p] > High[j]  for j = p − L … p − 1
                      High[p] ≥ High[j]  for j = p + 1 … p + R
Pivot low at bar p:   Low[p]  < Low[j]   for j = p − L … p − 1
                      Low[p]  ≤ Low[j]   for j = p + 1 … p + R
L is PivotLeftBars and R is PivotRightBars. The asymmetry settles ties: an equal high on the right does not cancel a pivot, but an equal high on the left does, so of two equal highs within reach of each other, the earlier bar becomes the pivot. Ties do occur in real data. In this export 10 pivot highs and 4 pivot lows had an equal extreme on the right, and 14 highs and 4 lows missed out only because an equal extreme sat on the left. In total the export has 313 pivot highs and 311 pivot lows. Code Counts
Pairs and the divergence test
When a new pivot is confirmed, the code compares it with the previous pivot of the same kind, and only that one. The pair is tested when the two pivots are between 5 and 60 bars apart and RSI already exists at the first pivot. A nearer pivot always blocks the comparison with an older one. Code
Regular bearish:  High[p2] > High[p1]  and  RSI[p2] < RSI[p1]
Regular bullish:  Low[p2]  < Low[p1]   and  RSI[p2] > RSI[p1]
Hidden bearish:   High[p2] < High[p1]  and  RSI[p2] > RSI[p1]
Hidden bullish:   Low[p2]  > Low[p1]   and  RSI[p2] < RSI[p1]
Reported on bar:  c = p2 + R
All comparisons are strict, so equal prices or equal RSI readings never make a divergence. With 5 bars on the left and 5 on the right, two pivots of the same kind are always at least 6 bars apart, so the minimum distance does not bind at the defaults. Rules
Settings
These are the inputs of the download. Every figure on this page uses the defaults, which are illustrative starting points rather than optimized values.
| Input | Default | What it controls |
|---|---|---|
RsiPeriod |
14 | RSI period on closing prices with Wilder smoothing. |
PivotLeftBars |
5 | Bars before a pivot that it must strictly exceed. |
PivotRightBars |
5 | Closed bars after a pivot that must not exceed it. This is also the confirmation lag. |
MinPivotDistance |
5 | Fewest bars allowed between the two pivots of a pair. |
MaxPivotDistance |
60 | Most bars allowed between the two pivots. The search for the previous pivot stops there. |
ShowHidden |
false | Adds hidden divergences as dotted lines with their own arrows. |
The period sets how much each new change counts. Wilder smoothing gives it a weight of 1/14 at the default and 1/9 or 1/25 at the alternative periods the MT5 help mentions, so a shorter period reacts more to each bar. PivotRightBars trades speed for confirmation: a larger value never adds pivots, and it delays every detection by the extra bars. MT5 help: RSI Values used on this page
Interpreting the real examples
Figures 2 to 4 come from the export through fixed selection rules. The rules for figures 2 and 3 rank detections by the RSI gap between the pivots and ignore what price did afterwards. Figure 4 deliberately selects a failure. Selection rules
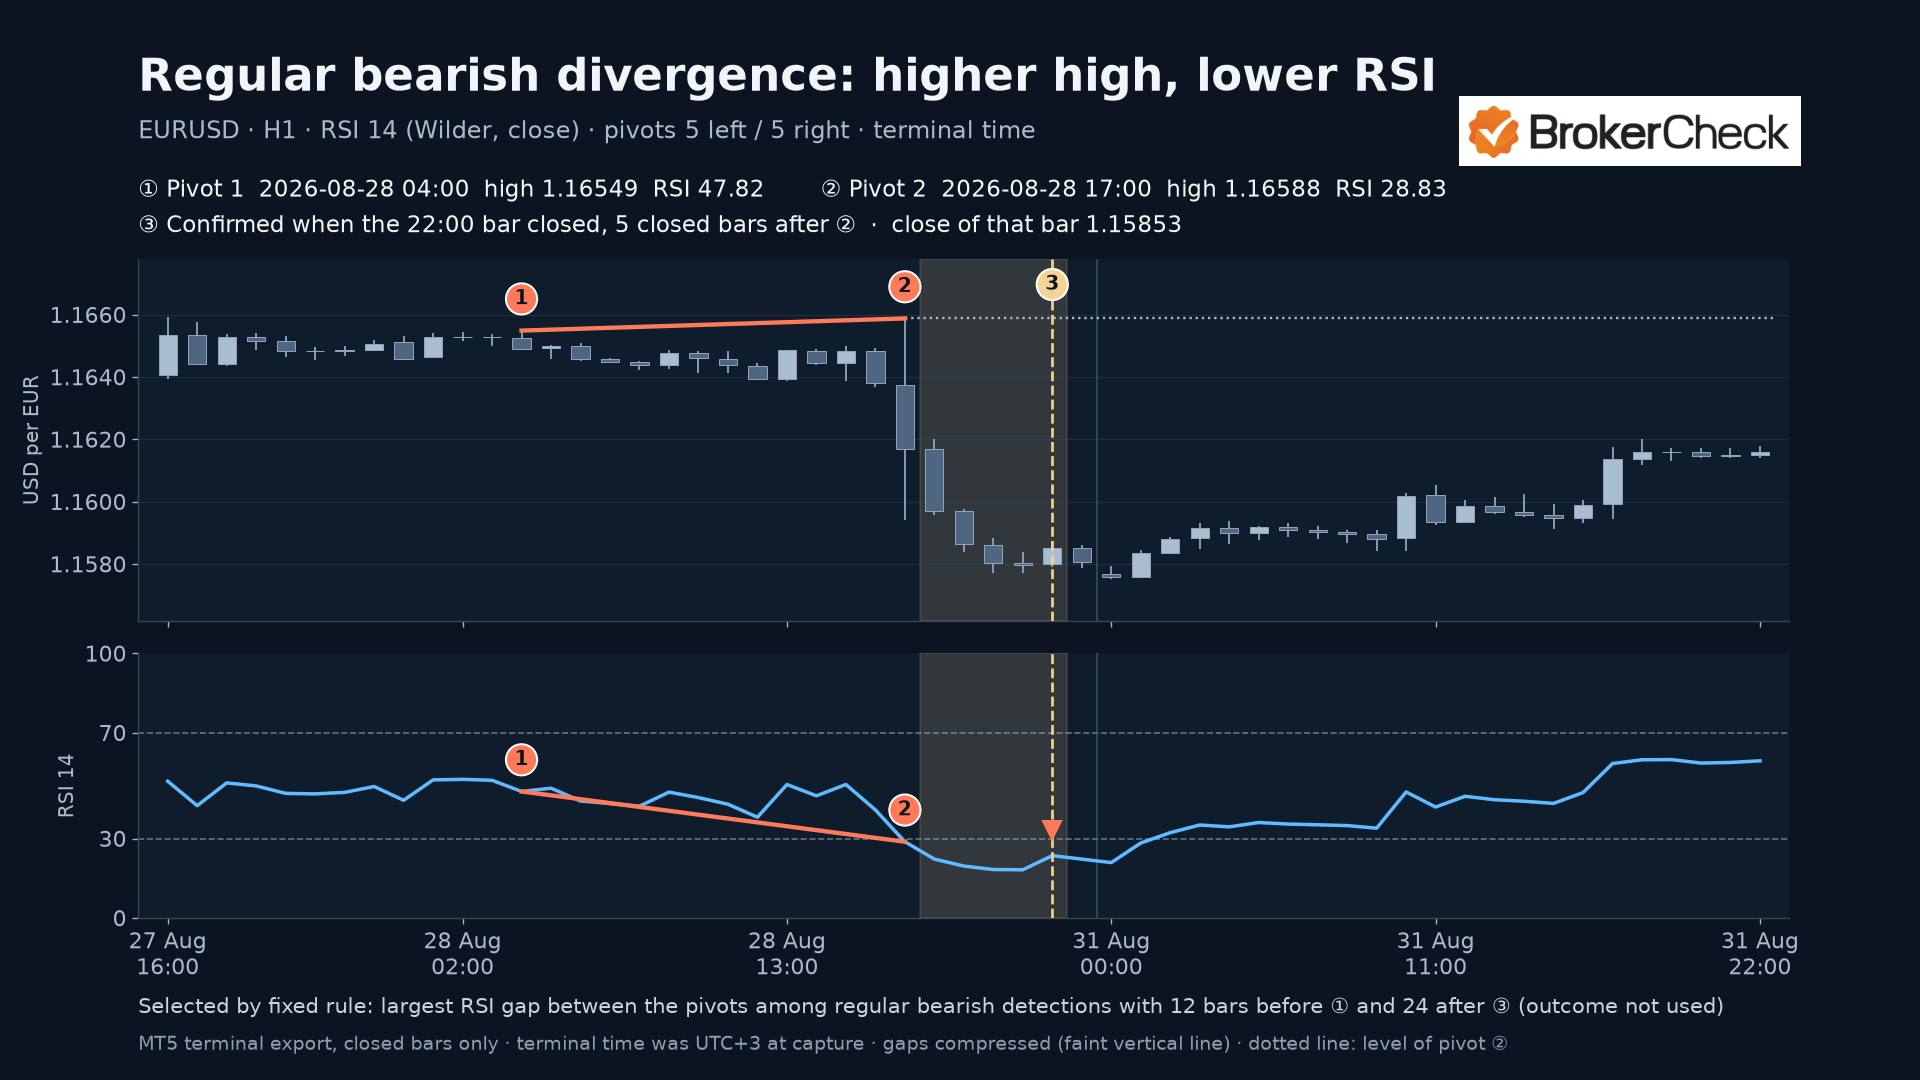
In figure 2 the second high is 0.00039 above the first, while RSI is 18.99 points lower. The two series are built from different prices: pivots use highs and lows, RSI uses closes. The bar that made the second high closed at 1.16168, 0.00420 below its own high and 0.00212 below the previous close, so RSI recorded a loss on the very bar that set the new high. Values used on this page
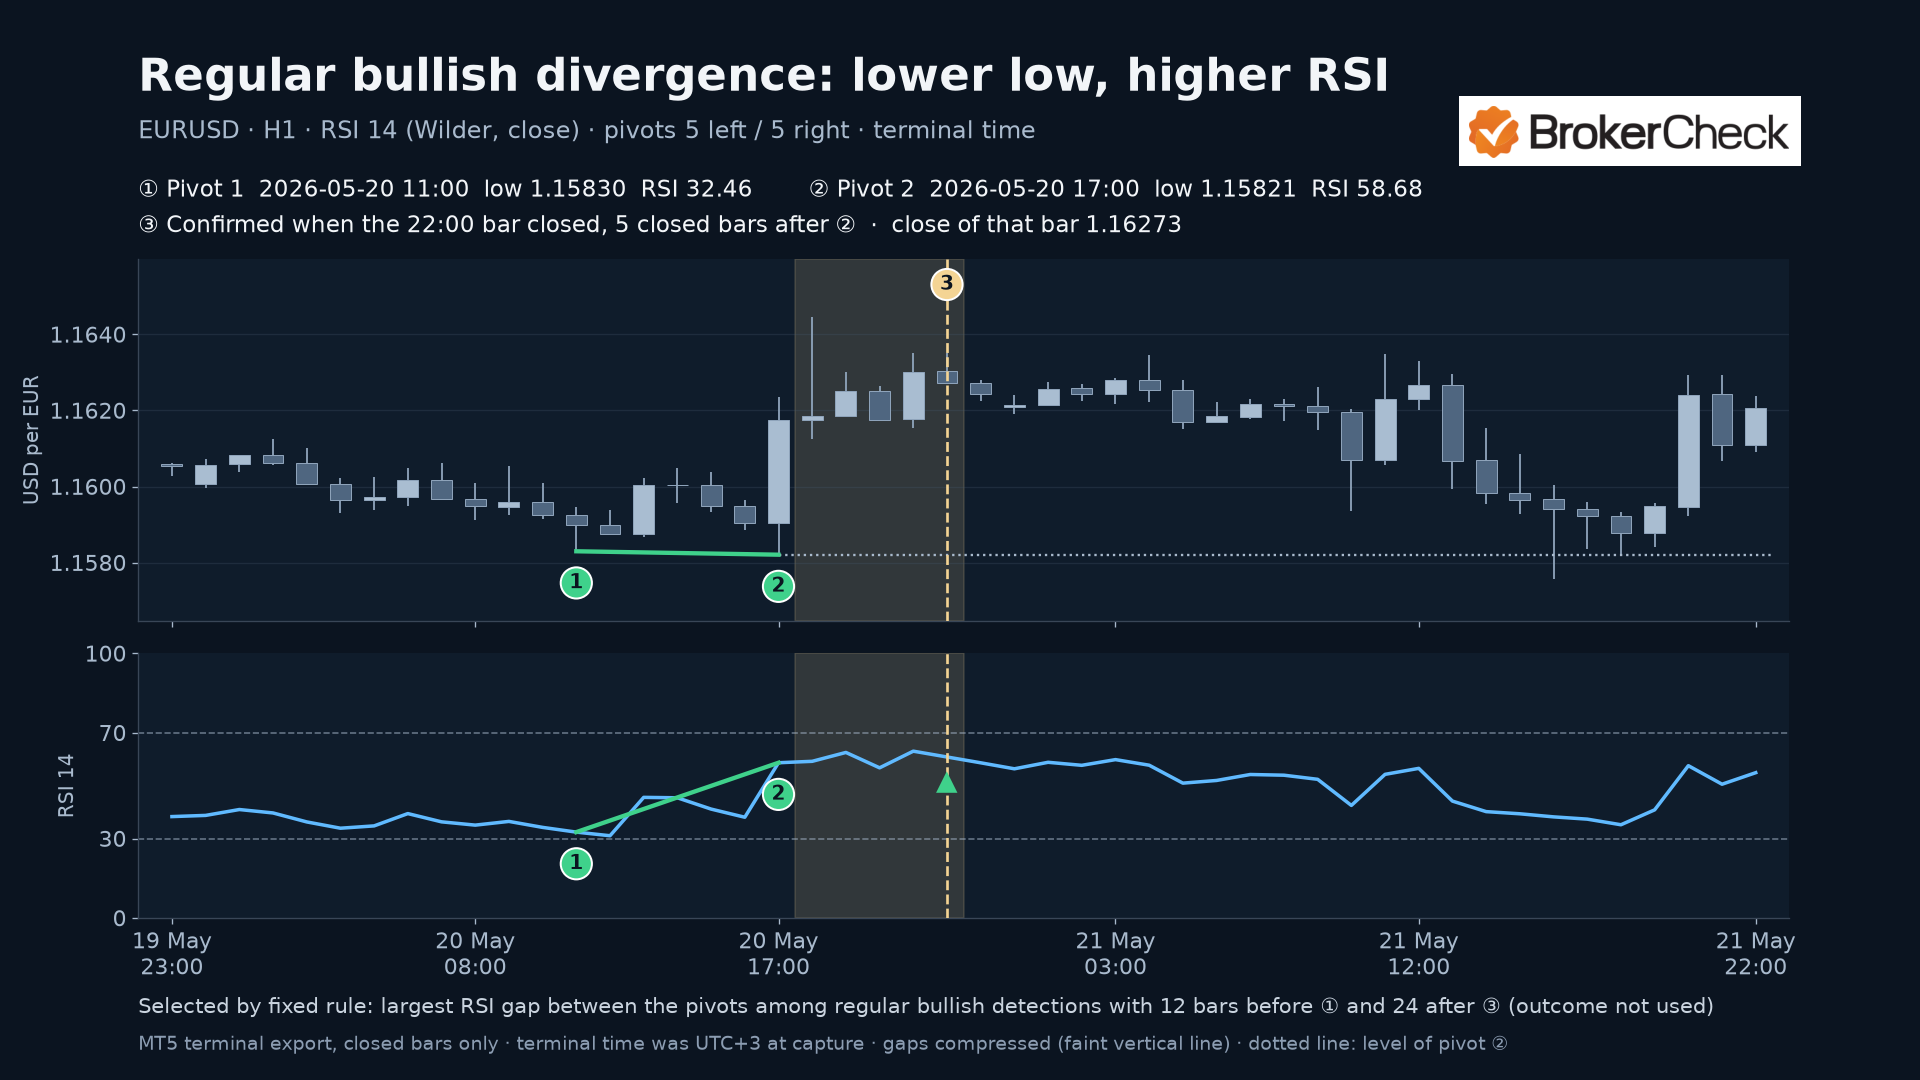
Figure 3’s second low is only 0.00009 below the first, which is 9 points at this symbol’s price step of 0.00001, while RSI is 26.22 points higher. The rule has no minimum size, so a difference that small counts like any other. Here too the pivot bar closed far from its extreme: at 1.16176, 0.00355 above its low and 0.00272 above the previous close. Values used on this page
Neither example was picked for its outcome. After the confirmation in figure 2, no high in the next 24 bars went above pivot 2. After the confirmation in figure 3, price went below pivot 2 at 2026-05-21 16:00 with a low of 1.15757, 18 bars after the confirming bar. Chart records
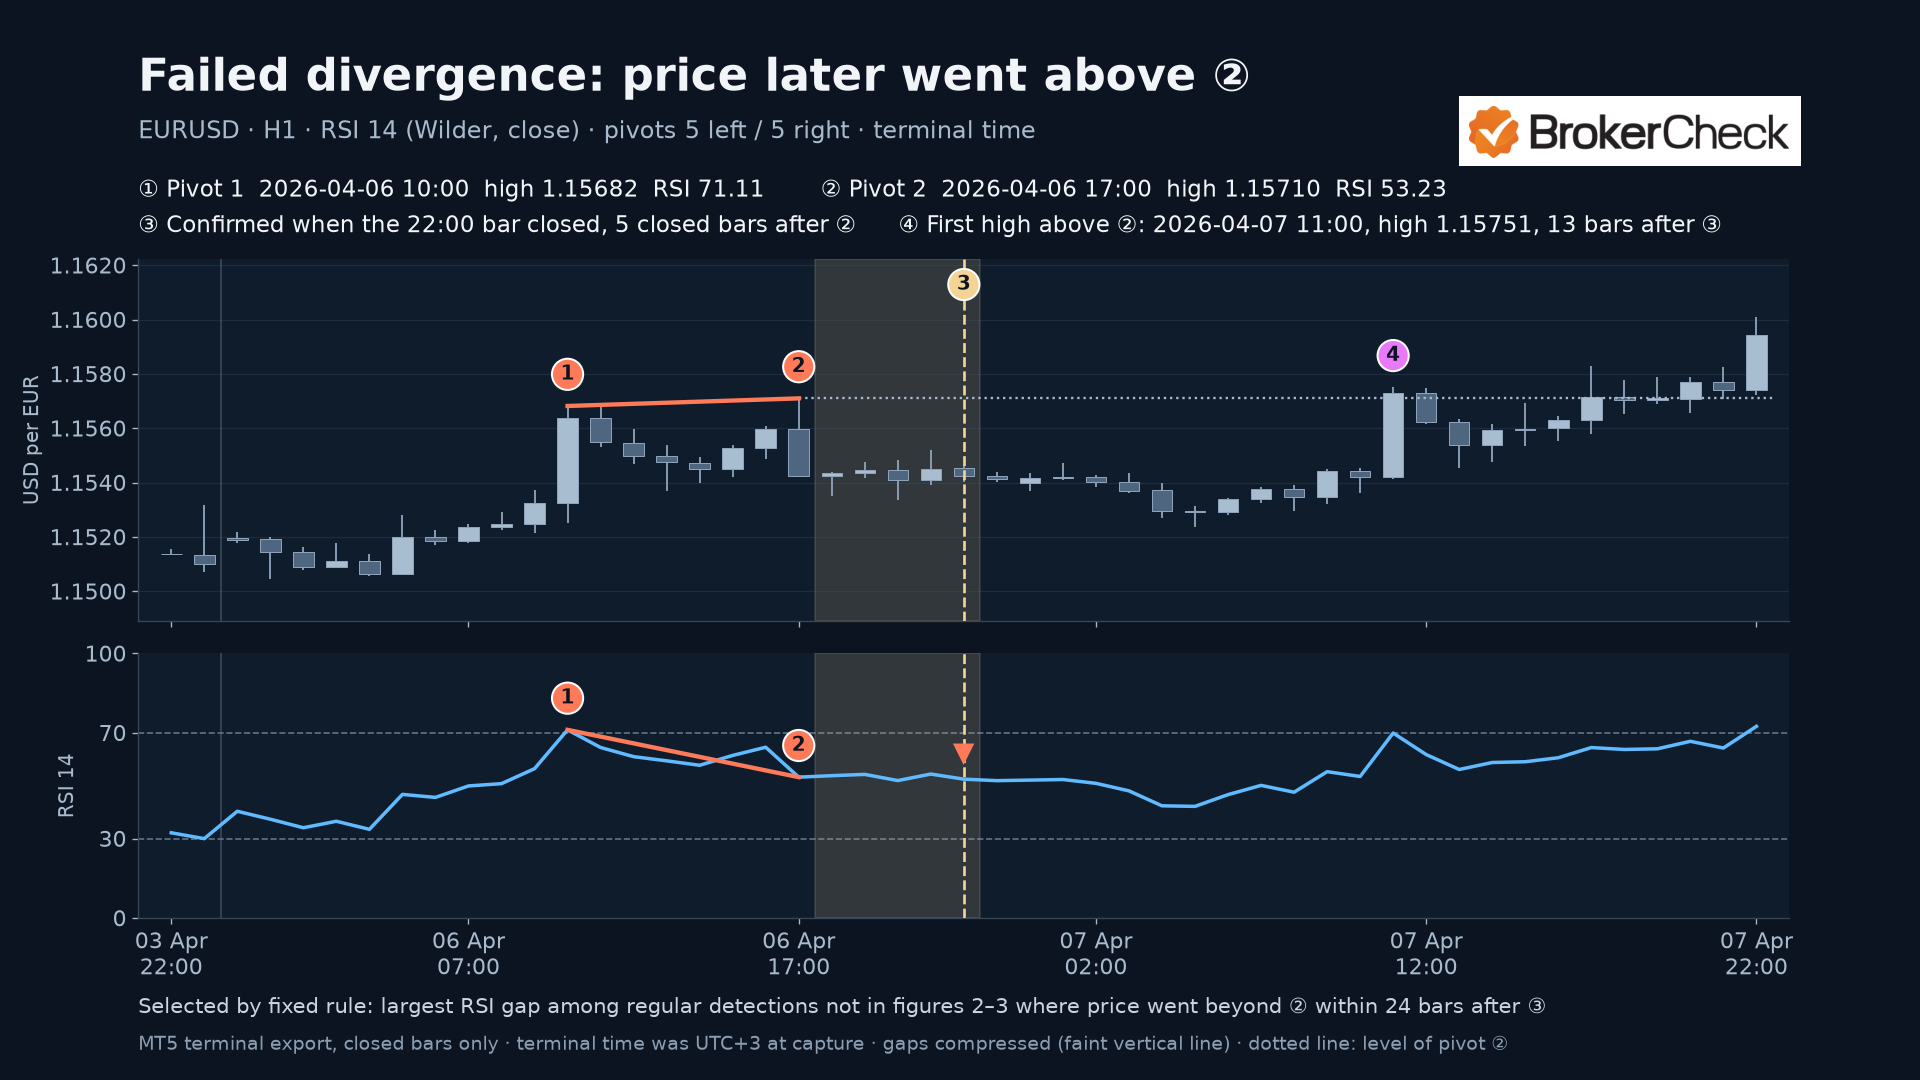
The detection in figure 4 was correct under the rules: a higher high with RSI 17.88 points lower. What failed is the expectation of a reversal. After a dip to a low of 1.15237 at 2026-04-07 05:00, price went on to the higher high. Chart records Values used on this page
What the sample shows
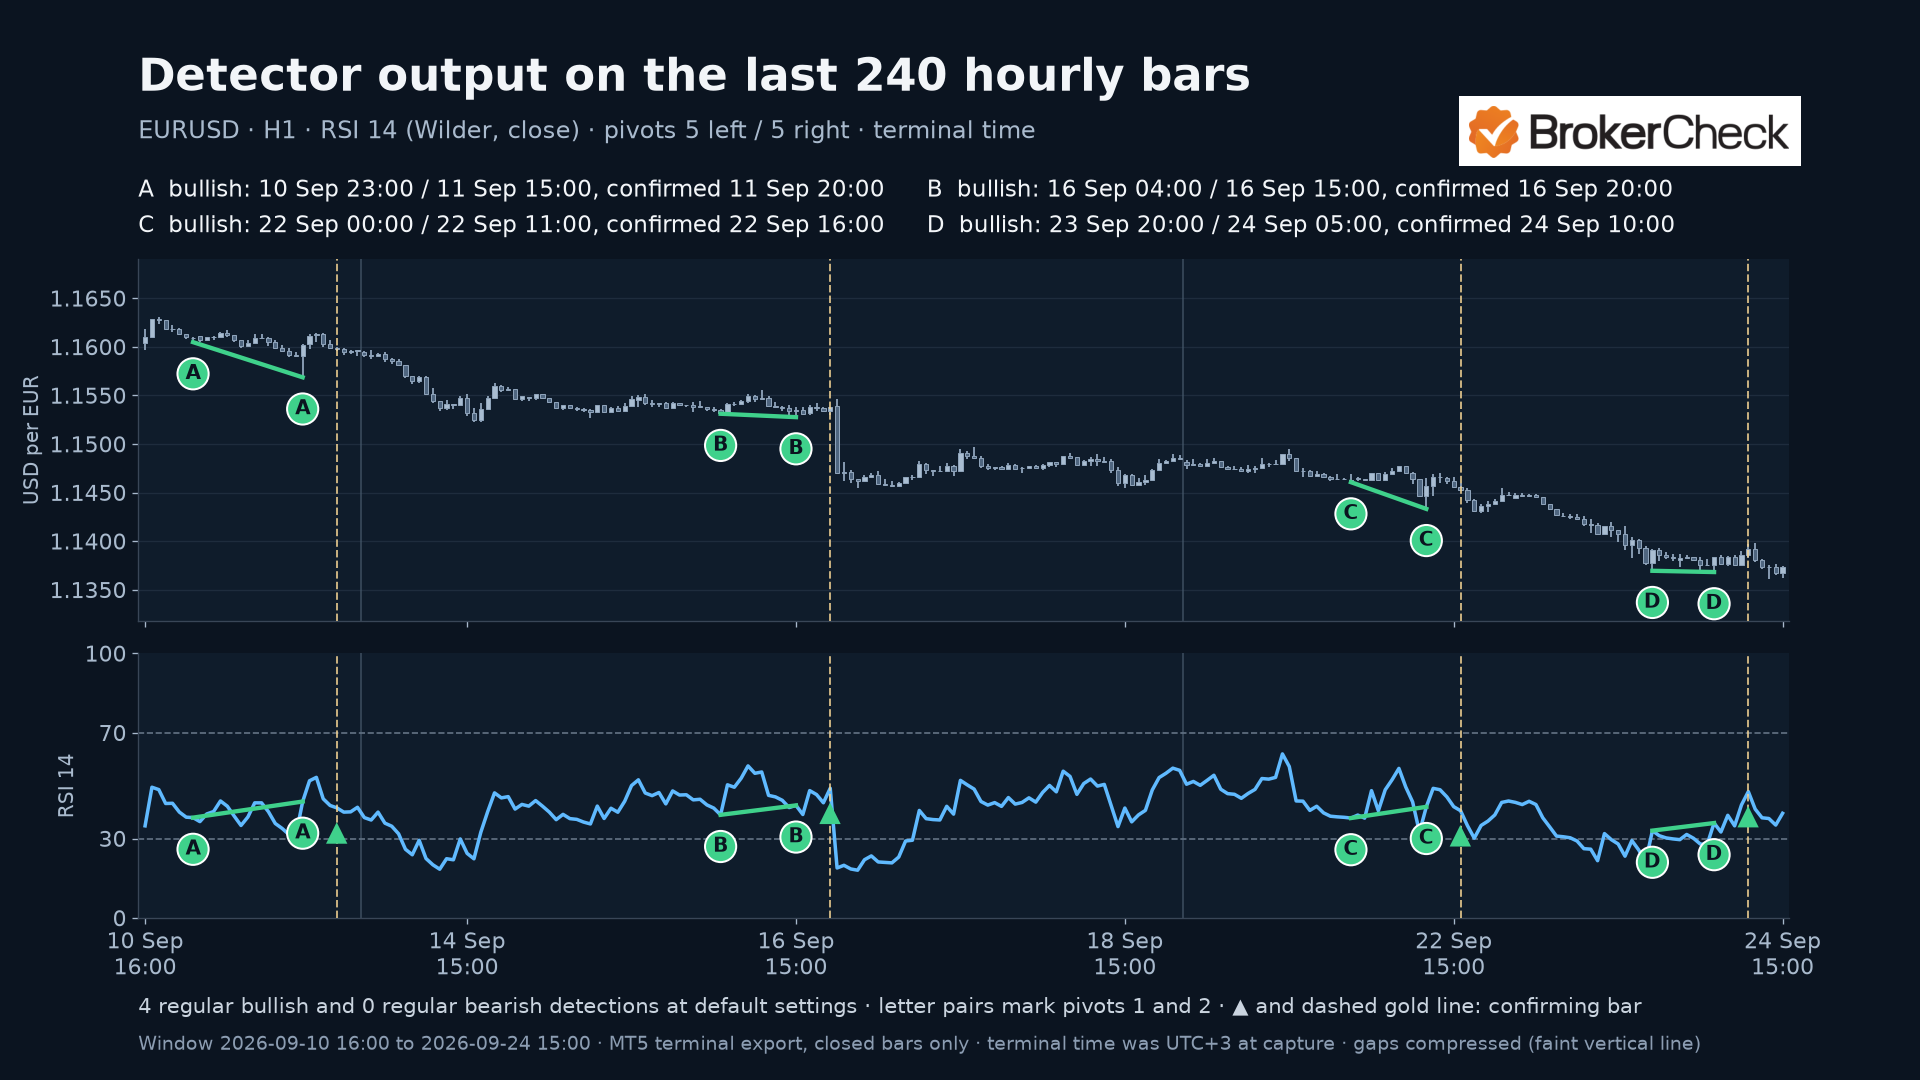
At default settings the export contains 73 regular detections: 29 bearish and 44 bullish. With ShowHidden switched on, 43 hidden bearish and 29 hidden bullish detections are added, 145 in total. These counts describe this sample under these rules. They are not hit rates, and no trading performance was tested. Counts
A divergence describes two swings that have already happened. What price does next is a separate question.
When a divergence becomes known
The confirmation lag
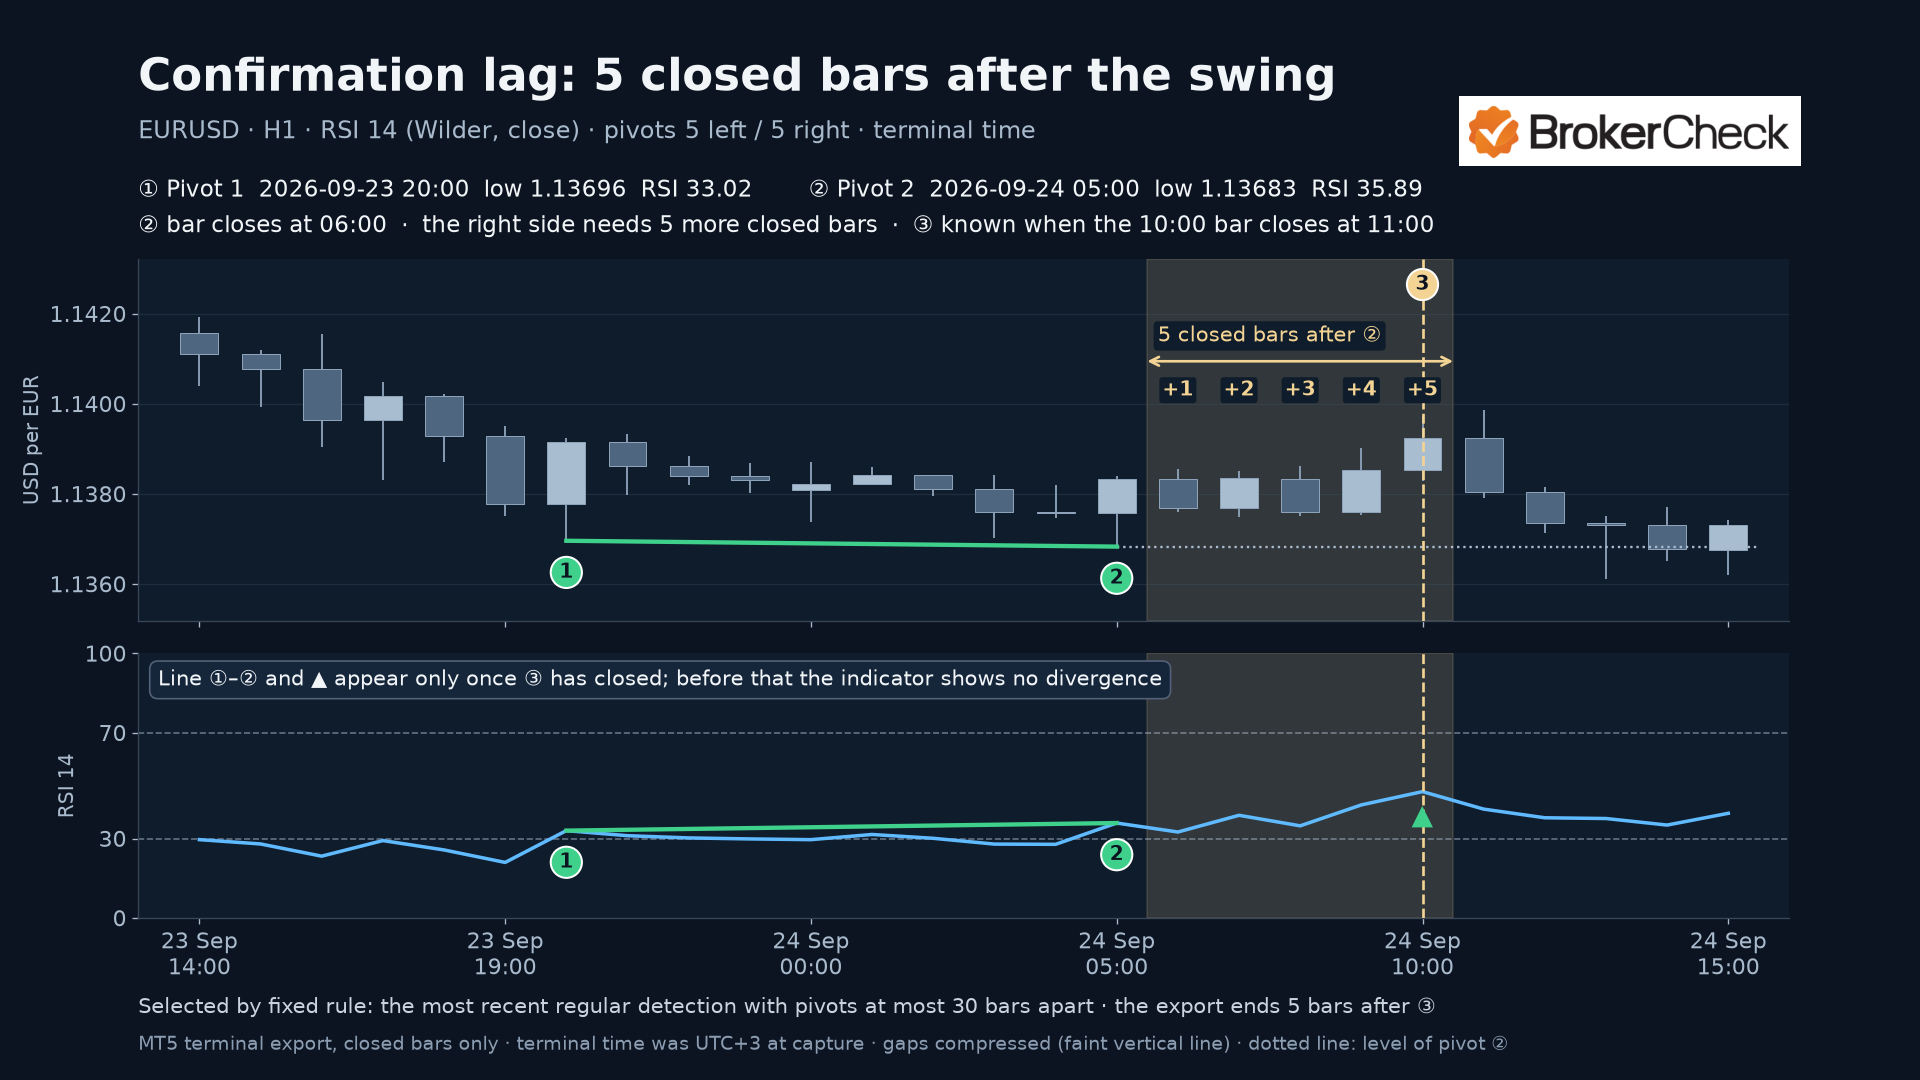
A pivot needs 5 closed bars on its right, so the detector cannot know about pivot 2 until the last of those bars has closed. The code puts the arrow on that confirming bar, not on pivot 2, and the line between the two RSI readings appears at the same moment. The newest bar on the chart is treated as still forming, so it never confirms a pivot. Code
Does it repaint?
Once written, a detection stays where it is as long as the closed history does not change. The native test replays all 5,000 bars one at a time, first with a changed intermediate tick on the newest bar and then with its final values, and checks at every step that detections appear only on their confirming bar and never change afterwards. The RSI value of the newest bar still moves with every tick, like any RSI. If the price history itself changes, for example when deeper history is downloaded, the terminal passes zero as prev_calculated and the indicator recalculates everything from the new data. Native test MQL5 reference: OnCalculate
A swing cannot be confirmed before the bars that define it have closed.
Combining with other tools
The detector compares two swings with two RSI readings and nothing else. Anything more is a separate rule that you would have to define and test yourself. This guide tests none of the following additions:
- Price levels. The dotted line in figures 2 to 5 extends the level of pivot 2. Whether price later trades beyond it is visible on the chart, and in figures 3 to 5 it did.
- RSI levels. A filter such as bullish detections only below 30 would be a new input. This download draws the 30 and 70 lines but does not filter by them.
- Other RSI readings. The MT5 help also describes tops and bottoms, chart formations, failure swings and support or resistance on the RSI line itself. The detector does not look for them.
- Trend filters and higher timeframes. A trend filter such as a moving average, or the same rules on a higher timeframe, would change which detections remain. This page does not measure either.
Limitations
- The detector describes past bars. It does not forecast, and no hit rate or trading result is reported.
- Every detection arrives 5 closed bars after pivot 2, by construction.
- Tiny differences count. Across 621 evaluated pairs, the smallest price difference was 0.00001, the symbol’s smallest price step, and the smallest RSI difference was 0.05 points. Exactly equal pivot prices occurred in 1 pair, which by rule was not a divergence.
- Pivots use highs and lows, but RSI uses closes. A bar with a long wick can set a new extreme and still close far from it, as in figures 2 and 3.
- Only neighbouring pivots are compared, at most 60 bars apart. A divergence between swings that are not neighbours is not reported.
- Values near the start of the loaded history depend on the seed and can differ from other RSI implementations.
- Times are the trade server’s clock, UTC+3 at capture; historical daylight-saving changes are not modelled. The charts compress weekend and other gaps.
- The MQL4 file has not been compiled or run in MT4.
Use the indicator
The steps below are for MT5. The .mq4 file targets MT4 and has not been tested there.
- Download the .mq5 source or the compiled .ex5 below.
- Open the data folder (File › Open Data Folder in MetaEditor) and copy the file into the MQL5\Indicators folder.
- If you use the source, open it in MetaEditor and press F7 to compile it. This creates the .ex5 file.
- In the MT5 Navigator window, drag the indicator onto a chart. It opens in a separate indicator window with its own scale, fixed from 0 to 100.
- Keep the defaults to match this page, or change the inputs from the settings table when you attach it.
Data folder Indicators folder and compiling Attaching indicators
MQL5 source
Editable native MQL5 code: RSI with divergence lines and arrows in a separate window. No orders, alerts, DLL imports or web requests.
MQL5 compiled
Built from this source with MetaEditor: 0 errors, 0 warnings. Attaching it to a live chart has not been tested.
MQL4 source
The same calculation section with MT4-style buffer setup. Static review only: not compiled or run in MT4.
What was checked
The calculation section of the MQL5 file was compiled, with only its entry function renamed, into a test program and run in the MT5 math tester on the same 5,000 bars. An independent reference implementation of the same rules processed the same rows. Its Wilder averages use an exponentially weighted mean, a different arithmetic form of the same recursion. Harness scope MQL5 reference: testing Exponentially weighted mean
All 4,986 RSI values agree within 4.97e-14 points, and 2,139 of them are bit-identical. The pass tolerance was 1e-9 points: well above the expected floating-point noise of about 1e-13 points and far finer than the 2 decimals the indicator displays. All 145 detections, with ShowHidden on, match exactly by type, confirming bar and both pivot bars. No decision sat near the tolerance: the smallest RSI difference behind any evaluated pair was 0.05 points. Cross-check Build log
The native program passed 41 of 41 checks, covering warm-up and seed, flat and one-way prices, equal highs and lows, known-answer divergences, insufficient history, a repeated tick, a changed forming bar, an appended bar, the bar-by-bar replay and the default ShowHidden setting. The cross-check script passed 24 of 24 comparisons. Native test Cross-check
These checks cover arithmetic and update logic. They do not cover drawing on a live chart, MT4, or trading results. Harness scope
Risk warning. Trading involves risk, and you can lose money. This indicator only marks past price and RSI patterns: it does not predict prices, place or protect orders, or manage risk. The examples illustrate the rules. They are not trading signals, and nothing on this page promises a result.
Frequently asked questions
What is an RSI divergence?
It is a disagreement between two price swings and the RSI readings at the same two bars. In a regular bearish divergence, price makes a higher swing high while RSI is lower at the second high. In a regular bullish divergence, price makes a lower swing low while RSI is higher at the second low.
How does this download calculate RSI?
It uses closing prices and Wilder smoothing with a period of 14. The first average gain and loss are simple means of the first 14 price changes; after that, each new change enters with a weight of 1/14. An RSI with different smoothing gives different values throughout. With the same smoothing but a different seed or first bar, the differences are largest near the start of the history and fade later.
Why does a divergence appear 5 bars after the swing?
A swing only becomes a pivot once the 5 bars to its right have closed without exceeding it. The indicator reports the divergence on the last of those bars and does not move it back to the pivot bar, so the chart shows what the indicator could know at that moment.
Does the indicator repaint?
Not after confirmation, as long as the closed history stays the same. A native replay of all 5,000 bars, with an intermediate tick on every new bar, found no detection that appeared early, moved or changed later. The RSI value of the forming bar still changes with each tick, and a change in the loaded history, such as deeper history being downloaded, makes the indicator recalculate everything.
What are hidden divergences?
A hidden bearish divergence is a lower swing high with a higher RSI; a hidden bullish divergence is a higher swing low with a lower RSI. They are off by default. Setting ShowHidden to true draws them as dotted lines with their own arrows. The cross-check compared them with the setting on, and the native test confirmed that the default setting draws no hidden divergences and leaves the regular ones unchanged.
Does a divergence mean that price will reverse?
This page does not show that. It describes one sample under fixed rules, and figures 3, 4 and 5 all show price moving past the second swing after confirmation. No hit rate or trading result was tested.
Can I use the MQL4 file in MT4?
The .mq4 file contains the same calculation section as the tested MQL5 file, with MT4-style buffer setup. It has only been reviewed statically: it was not compiled or run in MT4. Compile it in the MetaEditor that comes with MT4 and check the compiler log for errors and warnings before use.
Sources and reproducibility
MT5 help: Relative Strength Index: range, Wilder’s period and the popular alternatives, usual tops and bottoms, divergences, formula.
MT5 help: Moving Average: smoothed moving average formula.
MQL5 reference: OnCalculate: the prev_calculated value and full recalculation after price data changes.
MQL5 reference: copy_rates_from_pos: bar positions for the export; position zero is the current bar, which the export skips.
MQL5 reference: testing: the math calculations mode used for the native test.
Reference library documentation: exponentially weighted mean: the adjust=False recursion used by the independent check.
MetaEditor help: platform structure: the data folder and the indicator folders.
MT5 help: algorithmic trading: the MQL5\Indicators folder and compiling with F7.
MT5 help: technical indicators: attaching an indicator from the Navigator and separate indicator windows.
Values used on this page and in the charts · Exported bars · Export provenance · Reference RSI and pivots · Reference detections · Native MQL5 buffers · Native MQL5 detections · Cross-check · Native test run · Build log · Compiler log · Specification
The charts compress weekend and other gaps between bars. Times are the terminal’s trade-server clock as exported. The examples are fixed for reproducibility and are not live market commentary.