1. What is the Knoxville Divergence Indicator?
Knoxville Divergence is a technical analysis indicator used by traders to identify potential reversals in the market. It was developed by trader Rob Booker and is characterised by the simultaneous occurrence of a momentum indicator such as the Relative Strength Index (RSI) or Stochastic making new highs or lows, while the price does not confirm these highs or lows.
How Knoxville Divergence Works
The indicator consists of two main components working together:
- The Momentum Component: When price rises but momentum falls, this creates the first warning sign. The momentum indicator measures how fast the price is changing over time.
- The RSI Component: When RSI reaches extreme levels (above 70 or below 30) during momentum disagreement, it triggers the divergence signal. This confirms that buying or selling pressure is reaching exhaustion.
Knoxville Divergence Formula Settings
| Component | Standard Setting | Purpose |
| RSI Period | 21 periods | Measures momentum strength over 21 candles |
| Momentum Period | 20 periods | Tracks the rate of price change over 20 candles |
| Overbought Level | 70+ | Triggers bearish divergence signals |
| Oversold Level | 30- | Triggers bullish divergence signals |
Market Applications of Knoxville Divergence Indicator
The indicator can be used to analyse any chart timeframe from 1m up to monthly charts for the best readings. It works across various markets, including forex, stocks, and commodities.
The key advantage is early warning capability. While price continues in one direction, the divergence warns that momentum is shifting. This gives traders time to prepare for potential reversals before they become obvious to everyone else.
2. How to Use the Knoxville Divergence Indicator?
The Knoxville Divergence indicator automatically detects and displays divergence signals on your chart. Rather than manually searching for patterns, the indicator does all the calculations and shows clear visual signals when divergence occurs.
Optimising Indicator Settings
Before using the indicator, you have to optimise its settings to ensure the best possible results. The indicator offers three key parameters that can be adjusted based on your trading and market conditions:
Default Settings (from Rob Booker’s original):
- Bars Back: 150
- RSI Period: 21
- Momentum Period: 20
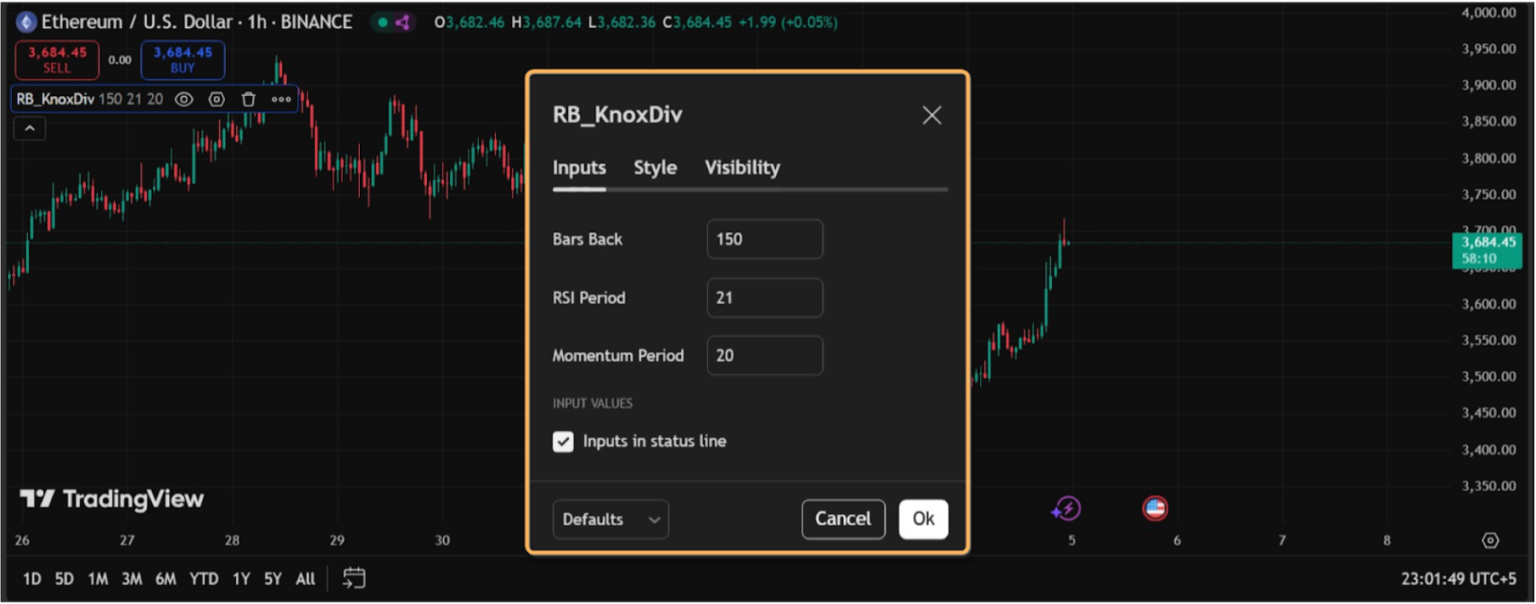
Optimized Settings for Different Trading s:
The following settings will help you trade optimally as per your :
| Trading | Bars Back | RSI Period | Momentum Period | Why These Settings |
| Scalping (1M-5M) | 100-120 | 14 | 15 | Faster signals, more responsive |
| Day Trading (15M-1H) | 130-150 | 18-21 | 18-22 | Balanced speed and accuracy |
| Swing Trading (4H-D1) | 180-220 | 21-25 | 20-25 | Fewer but higher-quality signals |
| Position Trading (D1-W1) | 250-300 | 25-30 | 25-30 | Maximum signal reliability |
Setting Up the Indicator
The Knoxville Divergence indicator is available on major trading platforms, including TradingView, Trading Ninja, MT4, and MT5. Here is how you can access and use this indicator:
Step 1: Open your favorite chart and search “Knoxville Divergence” in the indicators library.
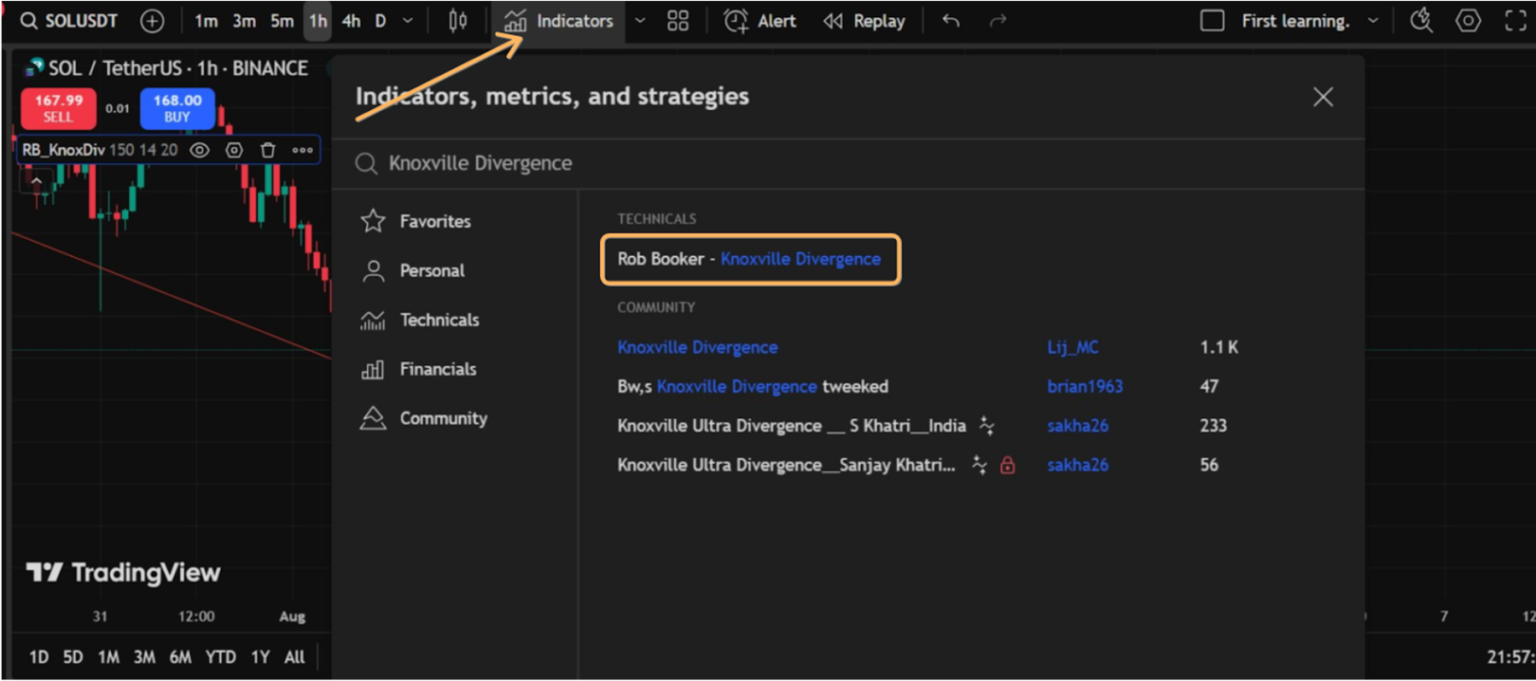
Step 2: Click the indicator, and it’ll automatically apply to the chart with default settings (Lookback: 50, RSI: 21, Momentum: 20).
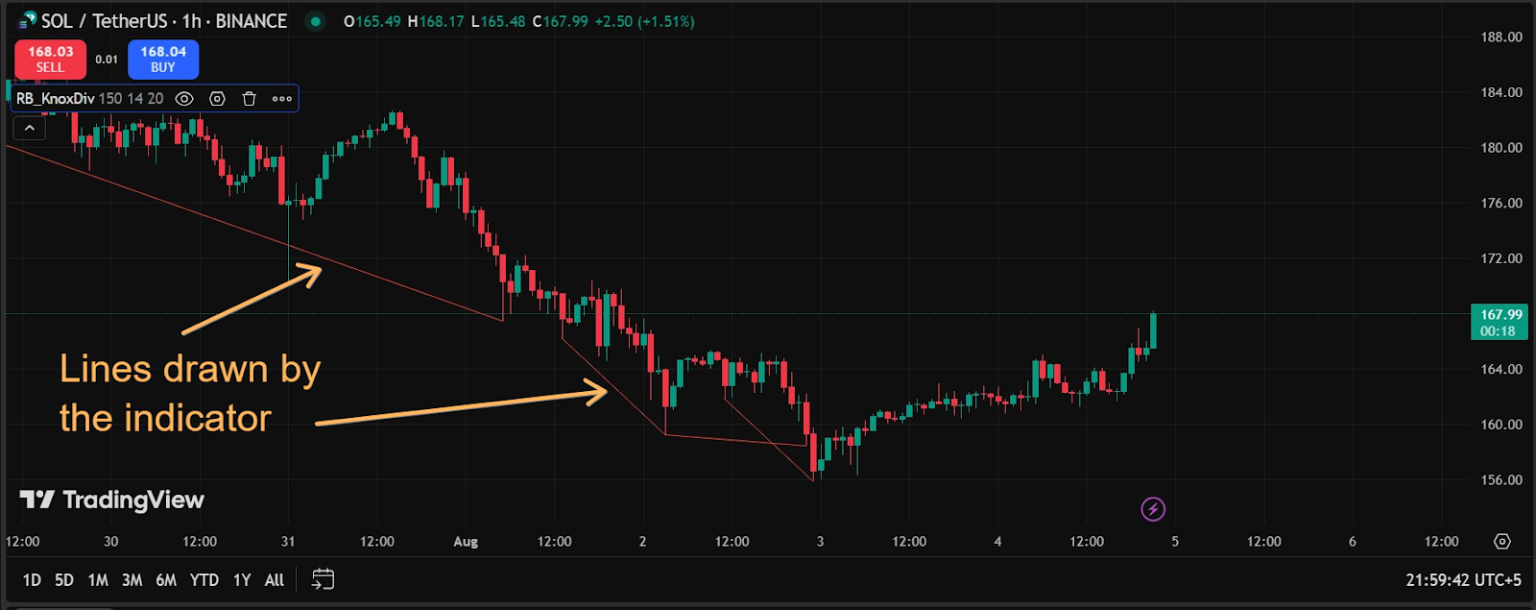
How to Read the Knoxville Divergence Indicator Signals?
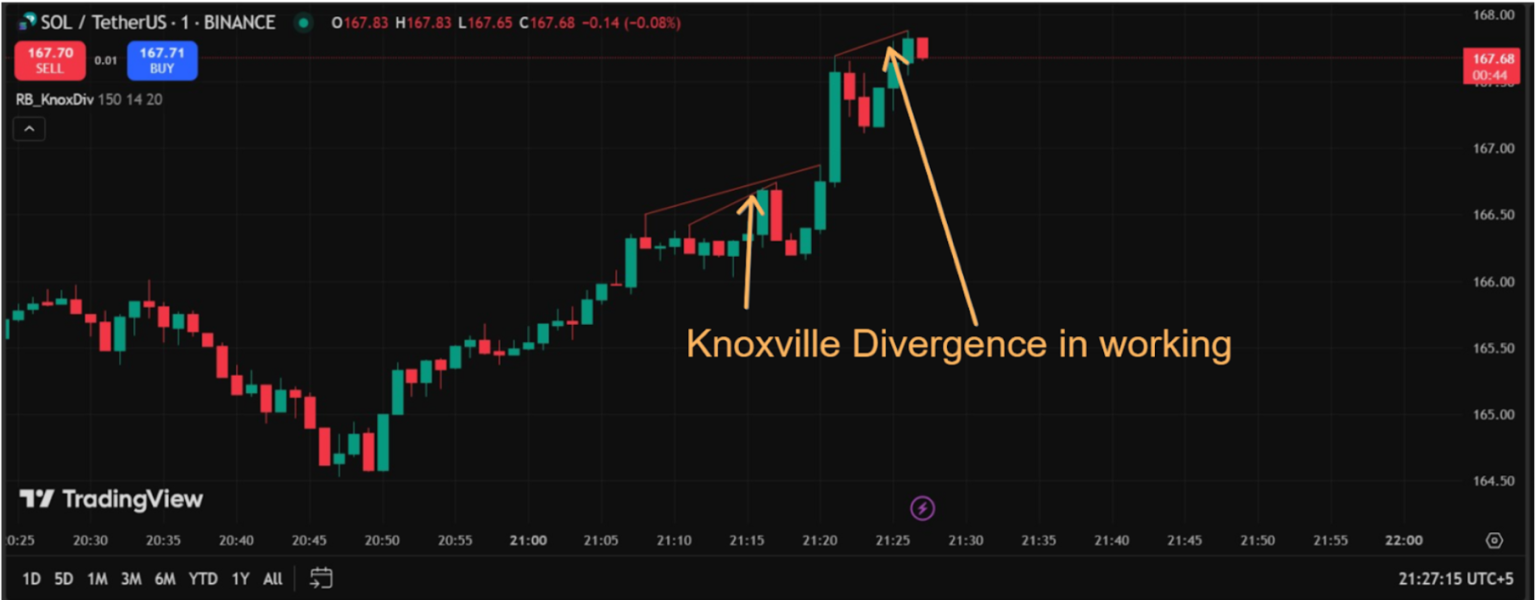
Once installed, the Knoxville Divergence indicator displays red/orange divergence lines on your chart:
Bullish Divergence Signals:
- Red lines below price connecting recent lows
- Appears when price makes lower lows but momentum strengthens
- Best signals occur at major support levels
- Often accompanied by oversold RSI readings (below 30)
Bearish Divergence Signals:
- Red lines above price connecting recent highs
- Appears when price makes higher highs but momentum weakens
- Strongest signals occur at major resistance levels
- Usually coincides with overbought RSI readings (above 70)
Interpreting Signal Strength
Remember, not all of the divergence signals produced by the market are equal and correct. The indicator helps you distinguish between high-quality and low-quality setups:
| Signal Quality | Characteristics | Action Recommended |
| Strong Signal | At key support/resistance, high volume, extended move | Consider trading |
| Moderate Signal | Some confirmation factors present | Wait for additional confirmation |
| Weak Signal | Mid-range location, low volume, recent divergence | Avoid trading |
3. How to Use Knoxville Divergence with Other Indicators?
A good way to use Knoxville Divergence is to integrate it with other indicators. The most successful traders use this indicator as part of a comprehensive trading system rather than a standalone signal generator. Here is how you can do that:
a. Combine with Support and Resistance Levels
Support and resistance are very important key levels in trading. When you use this indicator with these levels, your market prediction becomes even more solid.
For instance, a bullish Knoxville Divergence occurring at a significant support level may indicate a strong opportunity to go long. Conversely, a bearish divergence at a resistance level can be a powerful prompt to consider short positions.
| Divergence Type | Support/Resistance Level | Combined Signal Strength | Action Suggested |
| Bullish | At major support | Very Strong | Consider a long position |
| Bearish | At major resistance | Very Strong | Consider a short position |
| Bullish | No clear support | Weak | Wait for a better setup |
| Bearish | No clear resistance | Weak | Avoid trade |
b. Use with Volume and Other Indicators
Volume acts as a confirmatory tool for validating the strength of divergence signals. High volume with a divergence at key levels indicates stronger conviction among traders, suggesting a more reliable trade opportunity.
Here is how you can use the Knoxville Divergence indicator with other volume indicators:
| Indicator | Purpose | Signal Confirmation Method |
| Volume | Confirm movement strength | High volume at divergence = stronger signal |
| RSI | Gauge overbought/oversold | Alignment with divergence affirms reversal |
| MACD | Identify momentum changes | Convergence with divergence strengthens signal |
| Moving Averages | Define trend context | Price rejection at MA confirms divergence |
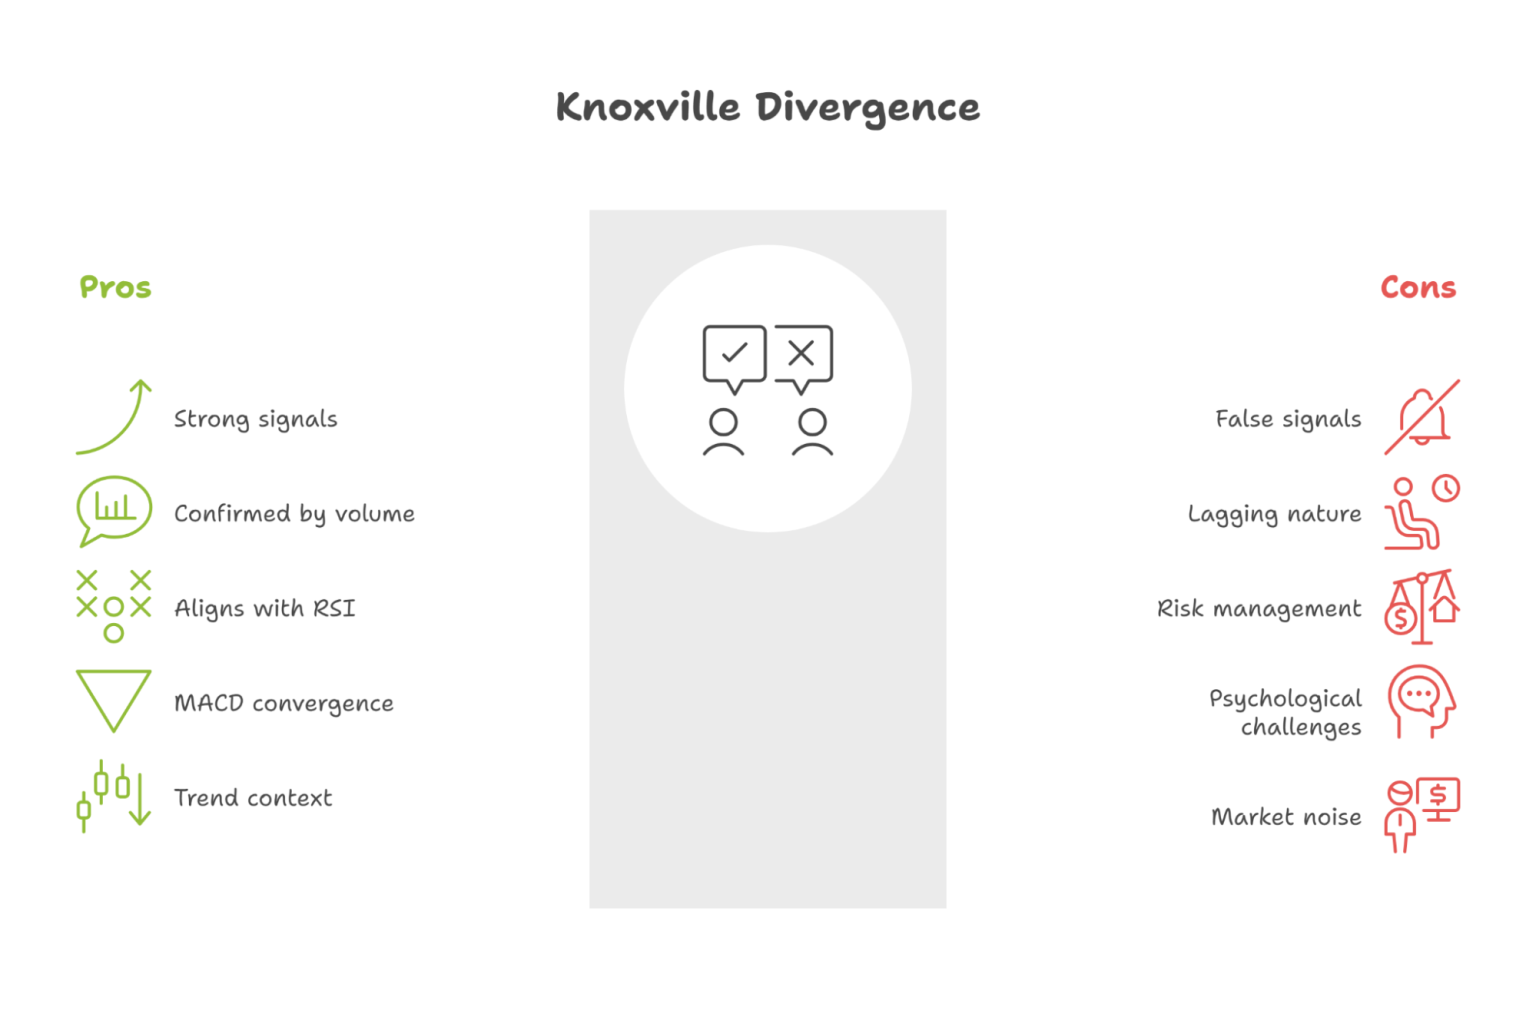
4. What Are the Limitations of Knoxville Divergence?
No doubts, Use Knoxville Divergence is a powerful indicator – it also has some limitations. To trade successfully in a market, you should be aware of these considerations:
a. Risk of False Signals
False signals represent the primary concern when using Knoxville Divergence. The indicator may signal a reversal that does not materialize, often due to market noise or short-term price fluctuations that do not affect the underlying trend.
Common False Signal Scenarios
| Market Condition | False Signal Rate | Why It Happens | Prevention Method |
| Choppy/Ranging Markets | High (40-50%) | Lack of clear trend direction | Avoid trades in ranging conditions |
| Low Volume Periods | Moderate (30-40%) | Insufficient market participation | Wait for volume confirmation |
| News Events | High (45-55%) | Fundamental factors override technical signals | Check the economic calendar |
| Strong Trending Markets | Low (15-25%) | Momentum often continues despite divergence | Use with trend context |
b. Lagging Nature and Timing Issues of Knoxville Divergence
The lagging nature of Knoxville Divergence occurs due to its reliance on historical data. Since it derives signals from past price movements, entries may happen after optimal timing.
This lag can result in:
- Missed opportunities when reversals happen quickly
- Late entries that reduce profit potential
- Increased risk as stop losses become wider
To mitigate timing issues, successful traders:
- Use multiple time frame analysis for better timing
- Wait for additional confirmation before entering
- Accept smaller position sizes for wider stops
- Focus on higher timeframe signals for better reliability
c. Risk Management Considerations of Knoxville Divergence Indicator
Effective risk management becomes crucial when trading divergence signals due to their inherent uncertainty.
Position Sizing Guidelines
| Signal Strength | Risk Per Trade | Stop Loss Placement | Profit Target |
| Strong Trend Signal | 2% of account | Beyond nearest swing point | 2:1 or 3:1 risk/reward |
| Range Reversal | 1% of account | Beyond support/resistance | 1.5:1 risk/reward |
| Weak/Unclear Signal | 0.5% of account | Tight stops | Quick scalp targets |
d. Psychological Challenges
Trading divergence signals present unique psychological challenges that can impact performance. For example:
Common Mental Traps
- Overconfidence after a few successful trades
- Revenge trading after false signals
- Analysis paralysis from too many confirmation requirements
- FOMO (fear of missing out) leading to premature entries
Maintaining Discipline
- Stick to predetermined entry and exit rules
- Accept that not every divergence will be profitable
- Focus on the long-term edge rather than individual trades
- Keep detailed trading records to track performance
Successful divergence trading requires acknowledging these limitations while developing systems to work within them. The goal is not perfect accuracy but consistent profitability over time through proper risk management and selective trade execution.
Conclusion
The summary is that the Knoxville Divergence Indicator is a powerful tool for identifying potential market reversals through the combination of momentum and RSI analysis.
While the indicator provides valuable early warning signals when price and momentum disagree, success depends heavily on proper implementation and realistic expectations.
The key lies in understanding that divergence signals work best when combined with support/resistance levels, volume confirmation, and appropriate market context rather than as standalone trading signals.
Remember that Knoxville Divergence is not a magic solution but rather one component of a complete trading strategy. As Rob Booker emphasizes, look for technical patterns that work consistently rather than trying to trade every divergence signal that appears on your charts.

Written by
Arsam Javed