1. Overview of the Gaps Indicator
1.1 What are Gaps?
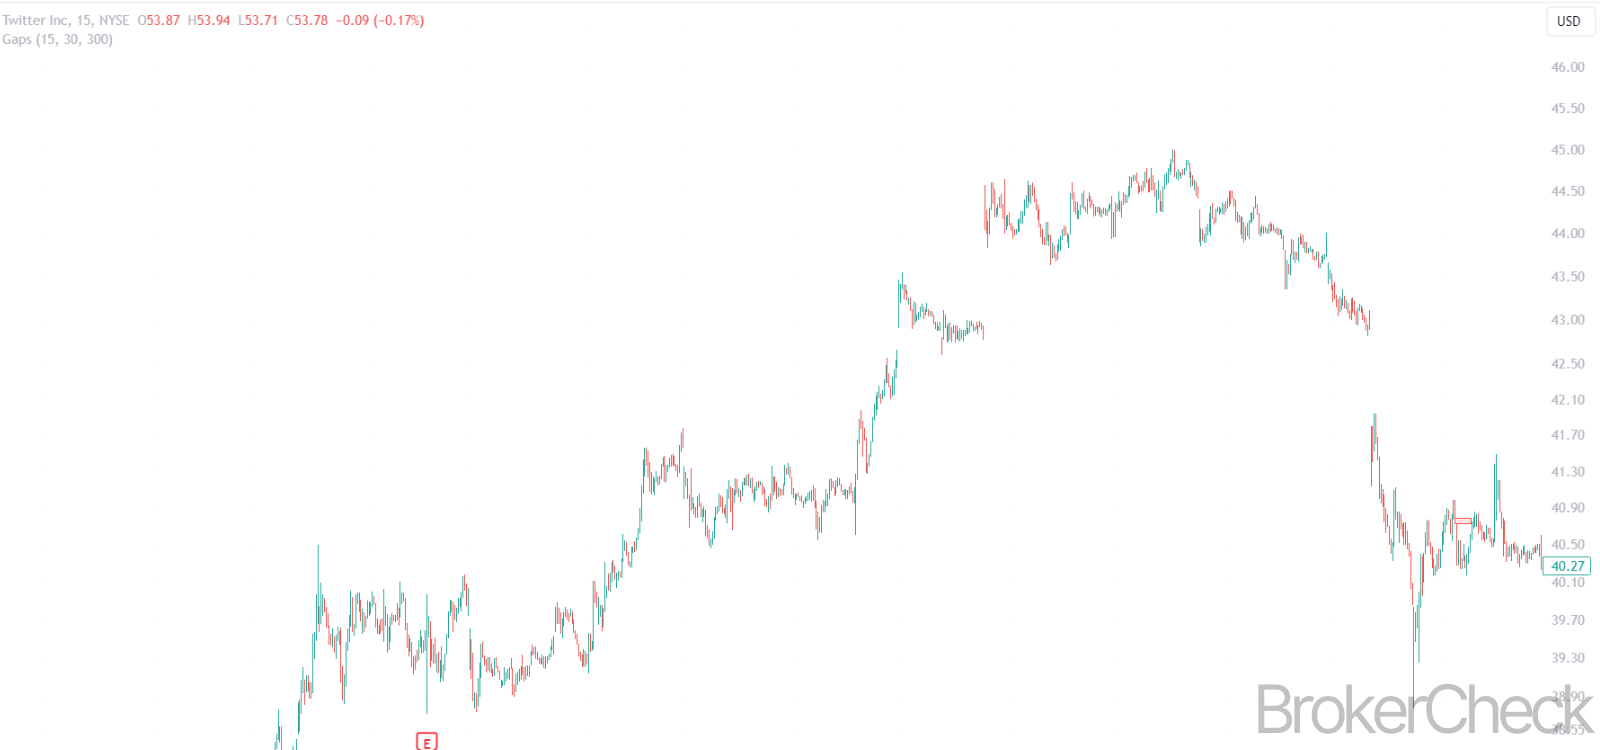
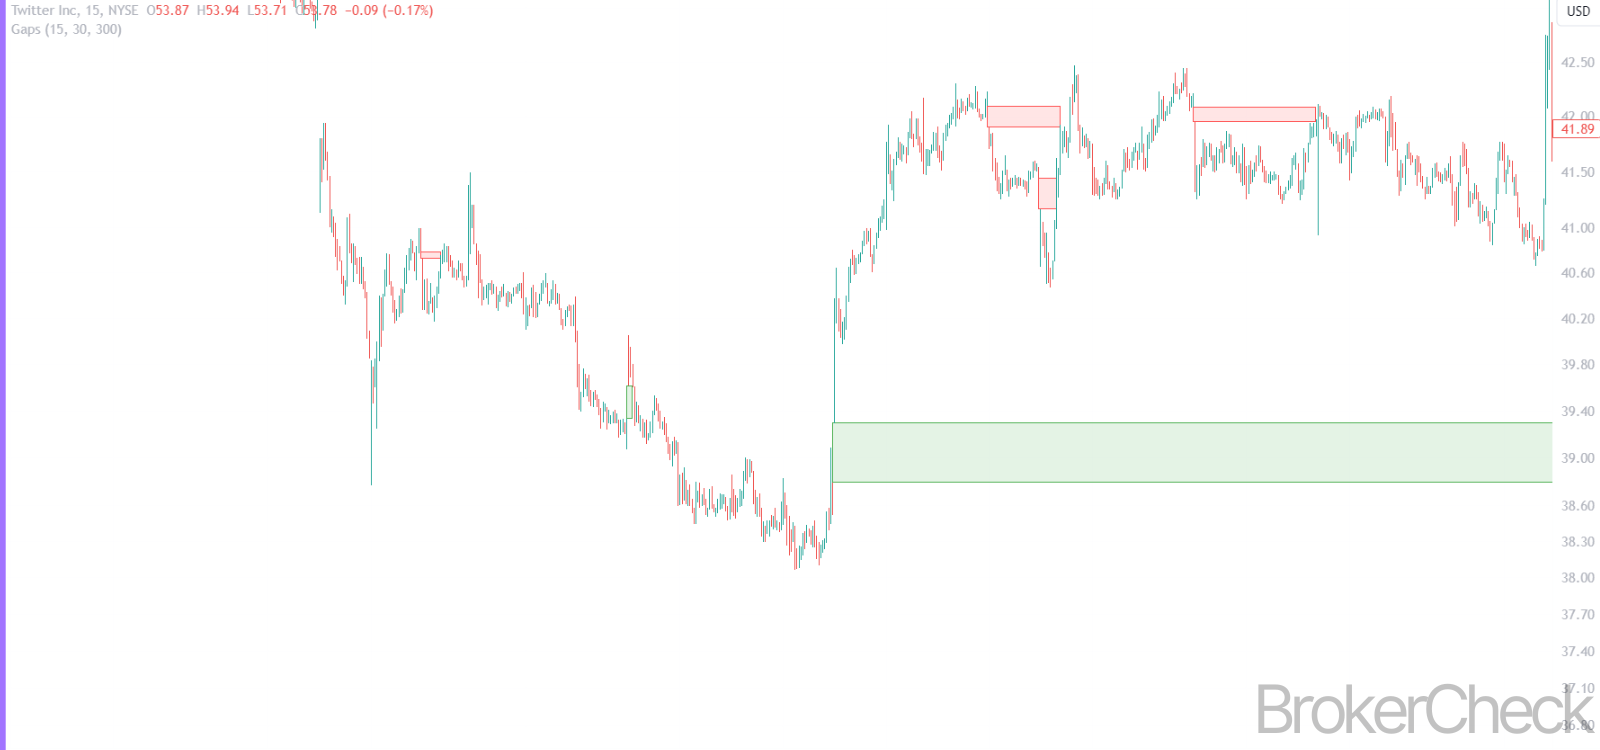
Gaps are a common occurrence in financial markets, often observed in stock, forex, and futures trading. They represent areas on a chart where the price of a security moves sharply up or down, with little or no trading in between. Essentially, a gap is the difference between the closing price of one period and the opening price of the next, indicating a significant change in investor sentiment or reaction to news events.
1.2 Types of Gaps
There are four primary types of gaps, each with unique characteristics:
- Common Gaps: These occur frequently and do not necessarily indicate any significant market move. They are often filled quickly.
- Breakaway Gaps: This type of gap signifies the start of a new market trend, usually occurring after a period of price consolidation.
- Runaway or Continuation Gaps: These gaps are typically seen in the middle of a trend and suggest a strong market move in the trend’s direction.
- Exhaustion Gaps: Occurring near the end of a trend, they signal the trend’s final push before a reversal or significant slowdown.
1.3 Importance in Trading
Gaps are significant for traders as they can indicate the start of a new trend, the continuation of an existing trend, or the end of a trend. They are often used in combination with other technical analysis tools to confirm trends and generate trading signals.
1.4 Advantages and Limitations
- Advantages:
- Gaps can provide early signals of market sentiment changes.
- They often accompany high trading volumes, adding to their significance.
- Gaps can serve as support or resistance levels in price movements.
- Limitations:
- Not all gaps provide meaningful insight, especially common gaps.
- They may be misleading in highly volatile markets.
- Gaps rely heavily on contextual interpretation and are best used with other indicators.
1.5 Applications Across Markets
While gaps are commonly associated with stock markets, they are also observed in forex, commodities, and futures markets. However, due to the 24-hour nature of some markets like forex, gaps are primarily seen after weekends or holidays.
| Aspect | Description |
|---|---|
| Nature | Areas on the chart where the price jumps between two trading periods without any trades in between. |
| Types | Common, Breakaway, Runaway/Continuation, Exhaustion |
| Significance | Indicate changes in market sentiment and trends. |
| Advantages | Early signals, accompanying high volume, support/resistance levels |
| Limitations | Can be misleading, reliant on market context, requires supplementary indicators |
| Market Applications | Stock, forex, commodities, futures |
2. Calculation Process and Technical Details
2.1 Identifying Gaps on Charts
Gaps are identified visually on a price chart. They appear as spaces where no trading has taken place. The calculation process is straightforward:
- For an Upward Gap: The lowest price after the gap is higher than the highest price before the gap.
- For a Downward Gap: The highest price after the gap is lower than the lowest price before the gap.
2.2 Time Frames and Chart Types
Gaps can be identified on various chart types (line, bar, candlestick) and time frames (daily, weekly, etc.). However, they are most commonly analyzed on daily charts for clarity.
2.3 Measuring the Gap
The size of the gap can provide insight into market sentiment:
- Gap Size = Opening Price (Post-Gap) – Closing Price (Pre-Gap)
- For downward gaps, the formula is reversed.
2.4 Technical Indicators for Contextual Analysis
While gaps themselves do not have a complex calculation, their significance is often assessed in conjunction with other technical indicators like:
- Volume: High volume can signify the strength of a gap.
- Moving Averages: To understand the prevailing trend.
- Oscillators (like RSI or MACD): To gauge market momentum.
2.5 Chart Patterns
Traders also observe chart patterns around gaps for better predictions, such as:
- Flags or Pennants: May form after a gap indicating a continuation.
- Head and Shoulders: Could signal a reversal after an exhaustion gap.
2.6 Automated Detection
Advanced trading platforms often provide tools for automatic gap detection, highlighting them on charts for ease of analysis.
| Aspect | Description |
|---|---|
| Identification | Visual identification on price charts |
| Calculation Formula | For upward gaps: Opening Price – Closing Price; for downward gaps, the formula is reversed |
| Relevant Time Frames | Most commonly analyzed on daily charts |
| Supplementary Indicators | Volume, Moving Averages, Oscillators |
| Chart Patterns | Flags, Pennants, Head and Shoulders, etc. |
| Automation | Many trading platforms offer tools for automatic gap detection |
3. Optimal Values for Setup in Different Timeframes
3.1 Timeframe Considerations
The significance of gaps can vary greatly depending on the timeframe being analyzed. Typically, longer timeframes (like weekly or monthly charts) indicate more significant market sentiment shifts, whereas shorter timeframes might reflect transient market emotions.
3.2 Daily Timeframe
- Best for: Identifying most types of gaps.
- Optimal Gap Size: A gap size of more than 2% of the stock price is generally considered significant.
- Volume: High volume post-gap confirms strength.
3.3 Weekly Timeframe
- Best for: Identifying longer-term market sentiment and trend changes.
- Optimal Gap Size: Larger gaps (over 3-5% of the stock price) are more significant.
- Volume: Consistently high volume post-gap over several weeks reinforces the gap’s importance.
3.4 Intraday Timeframes (1H, 4H)
- Best for: Short-term trading and gap plays.
- Optimal Gap Size: Smaller gaps (1% or less) are common and can offer quick trading opportunities.
- Volume: High volume immediately after the gap is critical for validation.
3.5 Forex and 24-hour Markets
- Special Consideration: Gaps are less frequent due to the 24-hour nature but are significant when they occur after weekends or major news events.
- Optimal Gap Size: Depends on the currency pair volatility; typically, a gap of 20-50 pips can be noteworthy.
- Volume: Volume analysis is less straightforward in forex; other indicators like volatility measures are more relevant.
| Timeframe | Optimal Gap Size | Volume Considerations | Notes |
|---|---|---|---|
| Daily | >2% of stock price | High volume post-gap | Most common for gap analysis |
| Weekly | 3-5% of stock price | Consistent high volume over weeks | Indicates longer-term trends |
| Intraday (1H, 4H) | 1% or less | Immediate high volume | Suitable for short-term trades |
| Forex/24-hour | 20-50 pips | Other indicators like volatility are more relevant | Gaps are rare but significant |
4. Interpretation of the Gaps Indicator
4.1 Understanding Gap Implications
Interpreting gaps correctly is crucial for making informed trading decisions. The nature of the gap often indicates potential market movements:
- Common Gaps: Typically ignored as they don’t indicate significant market changes.
- Breakaway Gaps: When a gap appears above a support level it may signal the start of a new trend; traders might look for entry points.
- Runaway Gaps: A gap that appears in a rising price may indicate a strong trend continuation; often used to add to or hold positions.
- Exhaustion Gaps: When a gap appears at a lower price in an uptrend, it suggests the end of a trend; traders might prepare for a reversal or take profits.
4.2 Context is Key
- Market Context: Always analyze gaps in the context of the overall market condition and news.
- Supporting Indicators: Use other technical indicators for confirmation (e.g., trend lines, moving averages).
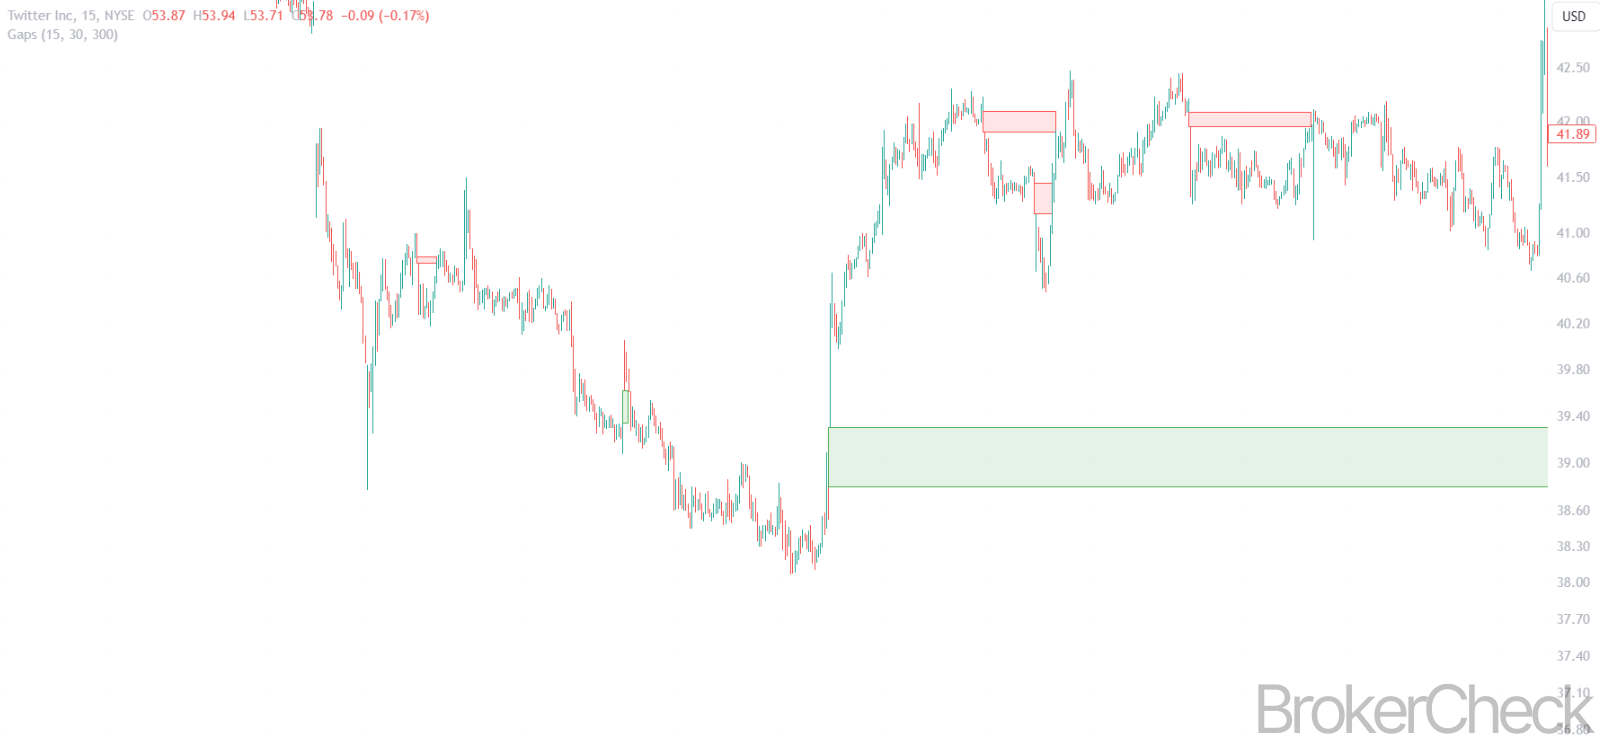
4.3 Gap Filling
- Gap Fill: A common phenomenon where price returns to its pre-gap level.
- Significance: A filled gap may indicate that the market has absorbed the gap’s impact.
4.4 Trading Strategies Based on Gaps
- Breakaway Gaps: Can be a signal to enter a new trend.
- Runaway Gaps: Opportunity to add to a winning position.
- Exhaustion Gaps: May warrant taking profits or preparing for a trend reversal.
4.5 Risk Considerations
- False Signals: Not all gaps will follow the expected pattern.
- Volatility: Gaps can increase market volatility, requiring careful risk management.
| Gap Type | Interpretation | Trading Strategy | Risk Consideration |
|---|---|---|---|
| Common | Neutral; often filled | Typically ignored | Low |
| Breakaway | Start of a new trend | Entry point for new trend | Medium; confirmation needed |
| Runaway | Continuation of a trend | Add to or hold position | Medium; monitor for trend strength |
| Exhaustion | End of a trend | Take profits or prepare for reversal | High; possibility of rapid reversal |
5. Combining the Gaps Indicator with Other Indicators
5.1 Enhancing Gap Analysis with Technical Indicators
To increase the reliability of trading signals derived from gaps, traders often combine gap analysis with other technical indicators. This multifaceted approach can provide a more comprehensive view of market conditions and potential movements.
5.2 Volume
- Role: Confirms the strength and significance of the gap.
- Application: A significant gap accompanied by high volume suggests a stronger signal.
- Combination: Use volume data to distinguish between breakaway and common gaps.
5.3 Moving Averages
- Role: Indicates the trend direction and potential support/resistance levels.
- Application: A gap away from a moving average can signal a strong trend initiation.
- Combination: Compare the gap position relative to moving averages (e.g., 50-day, 200-day) for trend confirmation.
5.4 Momentum Indicators (RSI, MACD)
- Role: Gauge the strength and sustainability of a trend.
- Application: Confirm the momentum following a gap.
- Combination: Look for divergence or convergence with the gap direction for potential trend reversals or continuations.
5.5 Candlestick Patterns
- Role: Provide additional context to the price action post-gap.
- Application: Identify reversal or continuation patterns post-gap for additional trade confirmation.
- Combination: Use candlestick patterns immediately after the gap to gauge market sentiment.
5.6 Chart Patterns
- Role: Indicate potential market movements and key levels.
- Application: Identify formations like flags, triangles, or head and shoulders around gaps.
- Combination: Use these patterns to predict potential gap closures or trend continuations.
| Indicator | Role in Gap Analysis | How to Combine |
|---|---|---|
| Volume | Strength confirmation | Confirm gap significance with volume spikes |
| Moving Averages | Trend direction and support/resistance | Compare gap position relative to key moving averages |
| Momentum Indicators (RSI, MACD) | Trend strength and sustainability | Use to confirm or question the gap’s implications |
| Candlestick Patterns | Market sentiment post-gap | Identify bullish or bearish patterns following a gap |
| Chart Patterns | Predictive market movements | Use to anticipate gap closures or continuation of trends |
6. Risk Management Strategies Related to Gaps
6.1 Recognizing the Risks
Gaps, while providing potential trading opportunities, also introduce risks, especially due to the increased volatility and potential for rapid price movements. Effective risk management strategies are crucial to navigate these risks.
6.2 Setting Stop Losses
- Importance: To limit potential losses from unexpected market movements after a gap.
- Strategy: Set stop losses at levels that invalidate your gap analysis (e.g., below a breakaway gap for a long position).
6.3 Position Sizing
- Role: To control the amount of risk taken on each trade.
- Application: Adjust position sizes based on the size of the gap and the associated volatility. Larger gaps might warrant smaller positions due to higher risk.
6.4 Gap Fills as Opportunities
- Observation: Many gaps eventually get filled.
- Strategy: Consider strategies that capitalize on gap fills, such as entering a trade with the expectation that a gap will close.
6.5 Diversification
- Purpose: To spread risk across various assets and strategies.
- Application: Do not rely solely on gap trading; incorporate it as part of a diversified trading approach.
6.6 Monitoring and Adaptability
- Need: Markets are dynamic, and gap interpretations can change.
- Approach: Regularly monitor open positions and be ready to adapt strategies in response to new market information.
| Strategy | Description | Application |
|---|---|---|
| Setting Stop Losses | Limits losses on a trade | Place stop losses at levels invalidating the gap analysis |
| Position Sizing | Controls risk exposure | Adjust size based on gap size and volatility |
| Gap Fills as Opportunities | Many gaps close eventually | Trade with the expectation of gap closure |
| Diversification | Spreads risk across assets and strategies | Include gap trading as part of a broader strategy |
| Monitoring and Adaptability | Markets change; strategies should too | Continuously assess and adjust open positions |

Written by
Arsam Javed